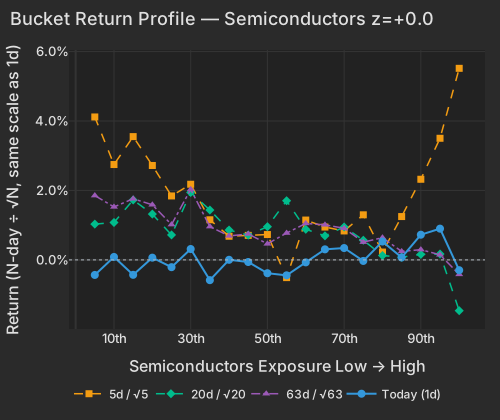
Both memory makers beat and both are being sold: the Roundhill Memory ETF (DRAM) is down -6.86%, handing back roughly a third of a +19.82% five-day run, while the Semiconductors factor sits at z=+0.0. Guidance on September-quarter pricing, not the chip cycle, is what broke this morning. Nvidia is higher and SiTime is up +28.24% on its own results — a complex that was selling off as a whole would not look like this.
Western Digital reported non-GAAP EPS of $3.56 against a $3.31 consensus with revenue up 44% year-on-year, and the stock is down -14.9%, taking $26.7B off its market value.Robinhood SanDisk posted record quarterly revenue of $8.97B and authorized a $14B buyback, then guided the September quarter to a $10.55B midpoint against a $10.82B street number; it is down -9.9%, shedding another $19.8B. Micron is off -4.38% in sympathy with no print of its own. The read-through runs offshore, too: EWY is down -3.88%, and Samsung and SK hynix are the two largest weights in the memory ETF at roughly 18% and 16%.Robinhood
| Factor | Return | Z-Score | 5d Z | 20d Z | 63d Z | Category | Direction |
|---|---|---|---|---|---|---|---|
| Profitability | -0.25% | z=-1.3 | -1.05 | +0.28 | -0.60 | Style | Least-profitable names led |
| Residual Volatility | -0.64% | z=-1.3 | +0.17 | -0.51 | -0.30 | Style-Risk | Highest-volatility names lagged |
| Treasury (Duration) | +0.36% | z=+1.1 | +0.13 | +1.21 | +0.24 | Thematic | Long-duration equities led |
| Growth | -0.24% | -0.98 | +0.66 | +0.43 | +1.54 | Style | Fast growers lagged |
| Short-Term Momentum | -0.16% | -0.49 | -2.50 | -4.14 | -3.15 | Style-Momentum | Prior week's leaders lagged |
| Short Interest | -0.11% | -0.63 | -0.28 | -0.91 | +0.88 | Style-Positioning | Most-shorted names lagged |
| Oil | +0.13% | +0.27 | -0.06 | -0.11 | -0.43 | Thematic | Oil-levered names led |
| Semiconductors | +0.02% | z=+0.0 | -0.97 | -1.49 | -1.21 | Thematic | No spread across the complex |
Two of the largest single-name declines in the market are semiconductor and storage names, and the Semiconductors factor produced +0.02% at z=+0.0. That is the whole finding. SMH is down only -0.54%, Nvidia is up +1.14%, and SiTime — a chip name that also reported — is up +28.24%, a move that is almost entirely its own rather than anything the factor complex handed it. Yesterday's session sorted the same way, with AMD falling 7% on a 50% revenue increase while Nvidia closed higher.CNBC The pressure is on DRAM and NAND pricing, and it is not generalizing.
| Bucket | Ret 1D Pct | Ret 5D Norm Pct | Ret 20D Norm Pct | Ret 63D Norm Pct |
|---|---|---|---|---|
| 1 | -0.43 | 4.12 | 1.03 | 1.85 |
| 2 | 0.08 | 2.75 | 1.08 | 1.52 |
| 3 | -0.43 | 3.55 | 1.73 | 1.76 |
| 4 | 0.06 | 2.72 | 1.32 | 1.59 |
| 5 | -0.21 | 1.84 | 0.72 | 1.02 |
| 6 | 0.31 | 2.18 | 1.94 | 2.03 |
| 7 | -0.58 | 1.16 | 1.44 | 0.96 |
| 8 | 0.00 | 0.68 | 0.86 | 0.69 |
| 9 | -0.06 | 0.71 | 0.71 | 0.75 |
| 10 | -0.38 | 0.73 | 0.96 | 0.46 |
| 11 | -0.44 | -0.51 | 1.70 | 0.77 |
| 12 | -0.07 | 1.15 | 0.88 | 1.05 |
| 13 | 0.30 | 0.95 | 0.69 | 1.01 |
| 14 | 0.34 | 0.83 | 0.95 | 0.91 |
| 15 | -0.03 | 1.30 | 0.57 | 0.51 |
| 16 | 0.53 | 0.23 | 0.13 | 0.64 |
| 17 | 0.07 | 1.25 | 0.08 | 0.24 |
| 18 | 0.73 | 2.32 | 0.16 | 0.30 |
| 19 | 0.90 | 3.50 | 0.17 | 0.15 |
| 20 | -0.30 | 5.52 | -1.46 | -0.42 |
The longer arc says the same thing from the other side. The Semiconductors factor has returned -4.00% over 20 sessions and -5.77% over 63, and the Philadelphia Semiconductor Index has been sitting below its late-June peak.Economic Times Memory itself is the round-trip: DRAM ran +19.82% in five sessions into these prints after a 20-day drawdown, and is giving a third of it back this morning.
| ETF | Theme | Today | 1d Ago | 5d Ago | 20d Ago | 63d Ago |
|---|---|---|---|---|---|---|
| DRAM | memory chips & storage | -6.86% | -2.10% | +19.82% | -13.38% | +16.09% |
| EWY | south korea | -3.88% | -1.17% | +17.29% | -7.43% | -2.50% |
| IGV | software | -2.62% | -0.68% | +9.68% | +9.55% | +14.77% |
| XLK | technology | -1.12% | -0.53% | +11.61% | +2.49% | +12.24% |
| SMH | semiconductors | -0.54% | -1.04% | +12.99% | -3.93% | +8.99% |
| SPY | large cap | +0.06% | -0.20% | +5.53% | +3.27% | +6.36% |
| XLU | utilities | +0.93% | -1.02% | -2.78% | -3.75% | -5.84% |
| XLE | energy | +1.29% | -2.07% | -2.28% | +3.08% | -3.60% |
| USO | oil | +1.41% | -0.78% | -11.16% | +2.38% | -20.32% |
Software is where the same logic bites hardest. Datadog beat on both lines and raised full-year revenue guidance to $4.45–$4.47B, and it is down -16.0% from a 52-week high, giving up $16.1B. AppLovin missed revenue by roughly $10M on 53% growth, guided the third quarter a shade light, and is down -19.0% for $26.7B. Neither move is factor carry — both are among the largest stock-specific declines in their own trailing year, and IGV at -2.62% is the aggregate of two names rather than a software sell-off. What is being rewarded is the unglamorous beat: Parker-Hannifin is up +8.31% on a record backlog and raised fiscal 2027 guidance, Paycom up +14.56%, Motorola Solutions up +5.62%. The top 50 high-beta momentum names are down -1.04% while the rest of the universe is flat — the damage is landing on what has already run.
This is the structure that makes a -15% gap coexist with SPY at +0.06%. Over the trailing 20 sessions, style variance measures 29.5 vol points — the 97th percentile since 2020 — while the index leg contributes 11.9 points at the 21.9th percentile, and the market's share of cross-sectional variance is 5.7%, near the bottom of the range since 2020. Implied dispersion (Cboe DSPX) at 40.55 is in the 98.1st percentile of its own history, so the options market has already paid up for exactly this configuration: implied single-stock volatility (Cboe VIXEQ) at 43.48 against implied index volatility (Cboe VIX) of 16.0. Realized pairwise correlation remains pinned near 8%, and none of that changed this morning — it is the standing condition into which the memory prints landed.
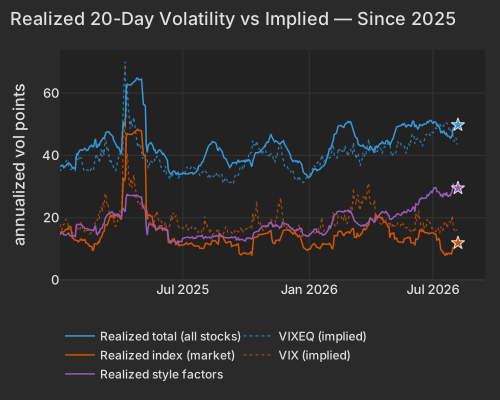
| Series | Today Vol Pts | Prev Close Vol Pts |
|---|---|---|
| total | 49.80 | 49.72 |
| market | 11.90 | 12.35 |
| style | 29.50 | 29.77 |
The momentum axis is the load-bearing one underneath. Short-Term Momentum has returned -5.93% over 20 sessions with a 20-day z of z=-4.1, but each week's leaders have been faded in turn as the window re-sorts — this is a recurring pattern, not one basket bleeding out. Today contributes -0.16% at z=-0.49, which is to say the pattern is running rather than accelerating. Long-Term Momentum tells you who is exposed: Western Digital carries a 12-month momentum tilt of +3.7 standard deviations into a print that shifted the argument from recovery to durability.
Profitability at z=-1.3 is the mirror image — the least-profitable decile returned +0.99%, led by Insmed at +28.14% after reporting before the open, with Rhythm Pharmaceuticals and Nuvation Bio alongside it. Money is paying for revenue inflection in loss-making biotech on the same morning it refuses to pay for a memory beat. Energy is the other bid: the median energy stock is up +1.35% with crude retracing after the Strait of Hormuz shipping headlines knocked USO down -11.16% over five sessions.EIA
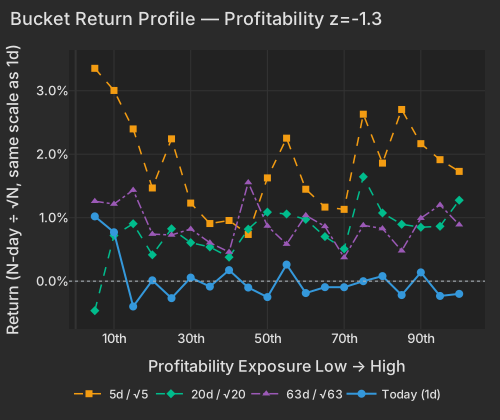
| Bucket | Ret 1D Pct | Ret 5D Norm Pct | Ret 20D Norm Pct | Ret 63D Norm Pct |
|---|---|---|---|---|
| 1 | 1.02 | 3.35 | -0.46 | 1.26 |
| 2 | 0.77 | 3.00 | 0.72 | 1.22 |
| 3 | -0.40 | 2.40 | 0.91 | 1.44 |
| 4 | 0.01 | 1.47 | 0.41 | 0.74 |
| 5 | -0.27 | 2.24 | 0.83 | 0.73 |
| 6 | 0.06 | 1.23 | 0.61 | 0.82 |
| 7 | -0.09 | 0.91 | 0.54 | 0.61 |
| 8 | 0.17 | 0.96 | 0.38 | 0.46 |
| 9 | -0.10 | 0.74 | 0.82 | 1.55 |
| 10 | -0.25 | 1.63 | 1.09 | 0.87 |
| 11 | 0.26 | 2.25 | 1.06 | 0.58 |
| 12 | -0.19 | 1.45 | 0.97 | 1.04 |
| 13 | -0.09 | 1.17 | 0.70 | 0.86 |
| 14 | -0.10 | 1.13 | 0.51 | 0.37 |
| 15 | -0.00 | 2.63 | 1.64 | 0.88 |
| 16 | 0.08 | 1.86 | 1.07 | 0.83 |
| 17 | -0.22 | 2.70 | 0.90 | 0.48 |
| 18 | 0.14 | 2.17 | 0.85 | 0.99 |
| 19 | -0.23 | 1.91 | 0.86 | 1.20 |
| 20 | -0.20 | 1.73 | 1.28 | 0.89 |
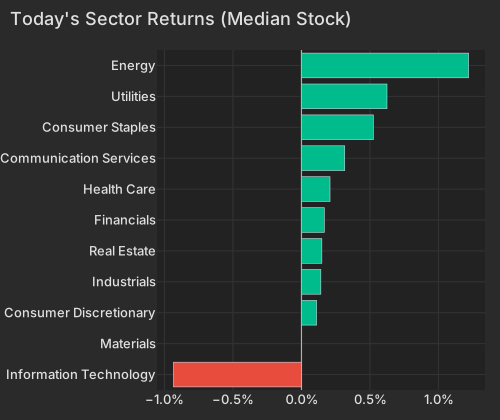
| Sector | Median Ret Pct |
|---|---|
| Information Technology | -0.93 |
| Materials | 0.00 |
| Consumer Discretionary | 0.11 |
| Industrials | 0.14 |
| Real Estate | 0.15 |
| Financials | 0.17 |
| Health Care | 0.21 |
| Communication Services | 0.32 |
| Consumer Staples | 0.52 |
| Utilities | 0.62 |
| Energy | 1.22 |
The case against reading this narrowly sits in the Treasury factor, up +0.36% at z=+1.1 with a 20-day z of z=+1.2, and it is rewarding long-duration equities on a morning when yields rose across the curve — the 10-year at 4.647%, up 3.0 bps.CNBC Duration-sensitive names outperforming into higher rates is not a rate story; it is money moving toward long-dated cash flows that nobody has just marked down. Constellation Energy, up +5.05% after reporting, carries that tilt. Whether the memory names find a bid once real liquidity arrives after the bell is the open question — pre-market marks on a two-name shock are not a session.
Initial Claims, released at 8:30 AM ET, showed new applications rising 1,000 to 199,000 for the week ending August 1, below the 202,000 consensus, with the four-week average down 4,500 to 198,750 — its lowest since mid-May. Oxford Economics read it as a "slow hire, slow fire" labor market normalizing rather than cracking; the front end took it hawishly, with the 2-year up 3.9 bps to 4.218%.CNBC The New York Fed's Global Supply Chain Pressure Index is due at 10:00 AM ET, with expectations leaning toward continued normalization and Red Sea maritime diversions the stated upside risk.
Variance decomposition: live intraday — 20260806 session, bracketed against its trailing-year range. Factor returns are trailing through last close. Total cross-sectional dispersion: 55%ile of the past year.
Variance mix — % of total, today vs 1d ago vs 1-yr avg
market 0.0%ile style 27%ile thematic 26%ile idiosyncratic 92.0%ile
Variance explained — today vs. factor's trailing-year range
Marker = the factor's share of today's total variance, placed in its own trailing-year range (box 25–75%ile, ticks 90%ile and max). Amber marker = unusually load-bearing today (≥90%ile of its own year). Factor name green = up today / red = down.
Correlation & dispersion — realized vs implied
Pairwise realized correlation (20d): 8.09% 3.2%ile since 2020 · 36%ile 3m
Top-500 pairwise: 10.74% 8.7%ile since 2020 · 54%ile 3m · implied (Cboe COR1M): 7.08 0.9%ile of its own history (gap +3.7pp)
Realized 20d vol (ann. pts): all stocks 50 vs VIXEQ 43 · index 12 vs VIX 16 · style factors 30 97.0%ile
20-day window (19 completed days + today); percentiles vs model history since 2020; '3m' tokens rank vs the trailing 63 trading days; definitions in Terms below. Implied prints (Cboe) are delayed ~15 min. as of 08:41 ET
Top 50 high-beta momentum names (eq-wt, since-2020 rank): -1.0% 30%ile · rest of market +0.0%
| Factor | Today | 1d | 5d | 20d | 60d |
|---|---|---|---|---|---|
| Style-Risk | |||||
| Residual Volatility | -0.64% z-1.3 | -0.56% | +0.19% | -1.16% | -2.28% |
| Beta | -0.50% z-0.5 | -0.35% | +3.00% | -3.56% | -4.30% |
| International | +0.06% z+0.2 | +0.14% | -1.13% | -0.02% | -1.57% |
| Style | |||||
| Profitability | -0.25% z-1.3 | -0.03% | -0.45% | +0.24% | -0.86% |
| Growth | -0.24% z-1.0 | +0.32% | +0.36% | +0.46% | +2.91% |
| Liquidity | -0.21% z-0.7 | -0.42% | -0.23% | -0.18% | -2.21% |
| Leverage | +0.13% z+0.7 | -0.24% | -0.76% | -1.22% | -1.69% |
| Value | -0.09% z-0.4 | -0.28% | +0.03% | +0.97% | -0.47% |
| Dividend Yield | +0.03% z+0.2 | -0.10% | -0.08% | -0.22% | -1.14% |
| Size | +0.04% z+0.1 | +0.14% | +0.39% | -0.31% | -1.00% |
| Style-Momentum | |||||
| Medium-Term Momentum | -0.17% z-0.6 | +0.35% | -0.20% | -0.14% | +1.43% |
| Short-Term Momentum | -0.16% z-0.5 | -0.78% | -1.80% | -5.93% | -8.64% |
| Long-Term Momentum | -0.25% z-0.4 | -0.51% | -2.12% | -4.84% | -6.00% |
| One-Day Momentum | -0.07% z-0.2 | -0.31% | -0.00% | +0.75% | +3.94% |
| Style-Positioning | |||||
| Short Interest | -0.11% z-0.6 | -0.11% | -0.11% | -0.69% | +1.42% |
| Hedge-Fund Ownership | -0.05% z-0.5 | +0.12% | +0.06% | -0.17% | -0.05% |
| Style-Flow | |||||
| Short-Sale Activity | -0.06% z-0.5 | -0.05% | +0.19% | +0.24% | -0.24% |
| Morning Activity | -0.02% z-0.1 | +0.22% | +0.29% | +0.63% | -0.38% |
| Thematic | |||||
| Treasury (Duration) | +0.36% z+1.1 | +0.32% | +0.10% | +1.82% | +1.08% |
| Bitcoin / Crypto | -0.10% z-0.3 | -0.11% | -0.89% | -1.08% | -1.45% |
| Oil | +0.13% z+0.3 | -0.45% | -0.07% | -0.24% | -3.30% |
| Gold | -0.04% z-0.1 | +0.67% | -0.18% | +0.84% | -4.00% |
| China | +0.04% z+0.1 | -0.28% | +0.07% | +1.02% | -3.25% |
| Semiconductors | +0.02% z+0.0 | -0.82% | -1.31% | -4.00% | -6.52% |
5/20/60d windows include today's session; 1d is the previous session.
Pairwise realized correlation. Index variance net of the weighted idiosyncratic diagonal, over the cross terms — the estimator used for implied-correlation indices. 20-day window unless noted; history since 2020.
Market variance share. The fraction of cross-sectional variance explained by the market factor — the attribution companion to pairwise correlation, not a substitute for it.
Factor z-score. Today's factor return divided by its daily-return standard deviation over ~1,600 trading days.
Conditional importance. A factor's relative share of what a tree-based fit of today's stock returns explains; sums to 100% across factors.
High-beta momentum cohort. US names above $2B market cap in the top quintile of both raw beta and 12-month momentum; membership frozen at each month's first business day. “Top 50” = the 50 strongest by combined rank.
Dispersion (realized). Total cross-sectional volatility net of the market component; high dispersion is the flip side of low correlation.
Stock-specific (idiosyncratic) return. The part of a stock's move not explained by market, style, or thematic factors in our decomposition.
VIXEQ / DSPX / COR1M. Cboe implied indices: single-stock volatility, dispersion, and 1-month implied correlation (top-50 S&P names). Quotes delayed ~15 minutes.
Data compiled by FactorPulse AI; edited and verified by Jeff Klein. For informational purposes only. Does not constitute financial advice, an investment recommendation, or an offer to buy or sell any securities. Always consult a qualified financial professional before making investment decisions.
For more on factor construction methodology, see www.factorpulse.com/glossary.