Western Digital and SanDisk marked down September-quarter contract pricing and the memory complex absorbed the hit by itself — DRAM -4.62%, WDC -12.99%, roughly $22 billion of market value erased in one name. The Semiconductors factor still rose +0.57% at z=+1.0, with the semiconductor exposure axis paying in the 96.7th percentile of sessions since 2020. What was repriced today is two companies' pricing outlook, not the silicon trade.
Western Digital's decline followed a disappointing outlook from the storage manufacturer Bloomberg, and the move was almost entirely the company's own: of its -12.99% session, the factor complex explains barely a percentage point, leaving the largest stock-specific drop in WDC's trailing year. SanDisk closed -6.59%. DRAM, which carries Samsung and SK hynix at a combined third of the fund alongside WDC Robinhood, took the read-through to Korea, and Micron clawed back to buck the peer group MarketWatch.
| Factor | Return | Z-Score | 5d Z | 20d Z | 63d Z | Category | Direction |
|---|---|---|---|---|---|---|---|
| Semiconductors | +0.57% | z=+0.9 | -0.6 | -1.3 | -1.1 | Thematic | High-exposure names outperformed |
| Oil | +0.50% | z=+1.0 | +0.3 | +0.1 | -0.3 | Thematic | High-exposure names outperformed |
| Short Interest | -0.28% | z=-1.6 | -0.7 | -1.1 | +0.8 | Style-Positioning | Most heavily shorted names underperformed |
| Profitability | -0.23% | z=-1.2 | -1.0 | +0.3 | -0.6 | Style | More profitable names underperformed |
| Treasury (Duration) | -0.16% | z=-0.5 | -0.6 | +0.9 | +0.0 | Thematic | Longer-duration names underperformed |
| Leverage | -0.13% | z=-0.8 | -2.6 | -1.9 | -1.5 | Style | More levered names underperformed |
| Short-Sale Activity | -0.06% | z=-0.6 | +0.7 | +0.5 | -0.5 | Style-Flow | Yesterday's most short-sold names underperformed |
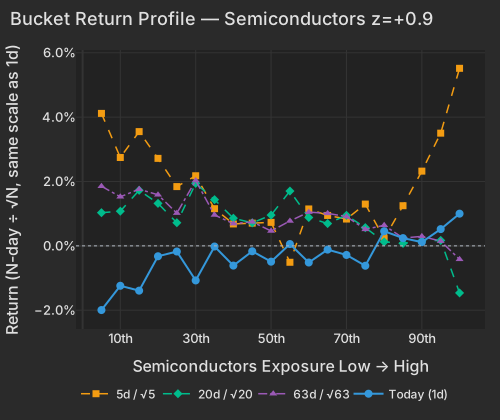
Against that, the exposure axis that should have transmitted the shock did the opposite. Sorted on semiconductor exposure, the top bucket returned +0.99% and the bottom bucket -1.89%, and the winners are chip names with nothing to do with NAND pricing — MACOM closed +14.74%, Diodes +15.50%, SiTime +26.71%, all three on their own results. A book hedged in semiconductor beta got no protection from the memory names and no damage from the rest.
| Bucket | Ret 1D Pct | Ret 5D Norm Pct | Ret 20D Norm Pct | Ret 63D Norm Pct |
|---|---|---|---|---|
| 1 | -1.99 | 4.12 | 1.03 | 1.85 |
| 2 | -1.24 | 2.75 | 1.08 | 1.52 |
| 3 | -1.39 | 3.55 | 1.73 | 1.76 |
| 4 | -0.32 | 2.72 | 1.32 | 1.59 |
| 5 | -0.18 | 1.84 | 0.72 | 1.02 |
| 6 | -1.07 | 2.18 | 1.94 | 2.03 |
| 7 | -0.02 | 1.16 | 1.44 | 0.96 |
| 8 | -0.61 | 0.68 | 0.86 | 0.69 |
| 9 | -0.17 | 0.71 | 0.71 | 0.75 |
| 10 | -0.49 | 0.73 | 0.96 | 0.46 |
| 11 | 0.06 | -0.51 | 1.70 | 0.77 |
| 12 | -0.52 | 1.15 | 0.88 | 1.05 |
| 13 | -0.12 | 0.95 | 0.69 | 1.01 |
| 14 | -0.28 | 0.83 | 0.95 | 0.91 |
| 15 | -0.62 | 1.30 | 0.57 | 0.51 |
| 16 | 0.46 | 0.23 | 0.13 | 0.64 |
| 17 | 0.24 | 1.25 | 0.08 | 0.24 |
| 18 | 0.12 | 2.32 | 0.16 | 0.30 |
| 19 | 0.52 | 3.50 | 0.17 | 0.15 |
| 20 | 1.00 | 5.52 | -1.46 | -0.42 |
The containment is not total, and the longer path is the qualifier. The Semiconductors factor is still -3.46% over 20 sessions and -5.97% over 60, so the high-exposure names have been on the wrong side of this axis for months. Korea took the read-through directly, and DRAM's five-day column shows a fund that had run up nearly 20% into these prints — today hands back a quarter of that, which is a valuation adjustment on a hot week rather than a break in the memory cycle.
| ETF | Theme | Today | 1d Ago | 5d Ago | 20d Ago | 63d Ago |
|---|---|---|---|---|---|---|
| USO | oil | +3.47% | -0.78% | -11.16% | +2.38% | -20.32% |
| XLE | energy | +1.43% | -2.07% | -2.28% | +3.08% | -3.60% |
| XBI | biotech | +1.27% | +0.74% | +3.45% | -6.11% | +14.37% |
| SMH | semiconductors | +0.46% | -1.04% | +12.99% | -3.93% | +8.99% |
| ITA | defense | -0.94% | +0.65% | +6.78% | +5.28% | +17.14% |
| IGV | software | -1.02% | -0.68% | +9.68% | +9.55% | +14.77% |
| KRE | regional banks | -1.20% | -0.64% | +1.52% | +5.45% | +10.61% |
| ITB | homebuilders | -2.39% | +1.40% | +4.45% | +5.18% | +8.70% |
| EWY | south korea | -2.87% | -1.17% | +17.29% | -7.43% | -2.50% |
| DRAM | memory chips & storage | -4.62% | -2.10% | +19.82% | -13.38% | +16.09% |
The one factor with a genuine multi-day signature is Leverage, down in each of the last five sessions for a cumulative -1.02% — the bottom 1.6% of all five-day windows since 2020. The driver is at the front of the curve: initial claims the BLS printed 199,000 and the 2-Year yield rose 6.4 bps to 4.243% against 4.7 bps at the 10-Year, now 4.664% CNBC, with equities pulling back for a second session on rate-hike expectations Bloomberg. Rate-geared equity followed: homebuilders led the losses through ITB, and regional banks underperformed the broader financial sector Bloomberg, KRE -1.20% against XLF -0.38%. UWM Holdings, which sits three standard deviations out on the levered end of the exposure, closed -35.05%.
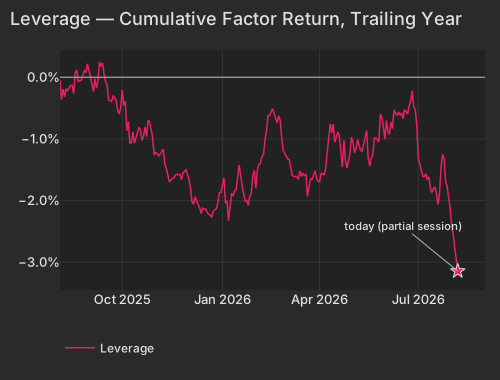
| Date | Cumret Pct |
|---|---|
| 2025-08-05 | -0.04 |
| 2025-08-07 | -0.19 |
| 2025-08-12 | -0.22 |
| 2025-08-14 | -0.13 |
| 2025-08-19 | 0.07 |
| 2025-08-21 | -0.07 |
| 2025-08-26 | 0.02 |
| 2025-08-28 | 0.07 |
| 2025-09-03 | -0.14 |
| 2025-09-05 | -0.02 |
| 2025-09-10 | 0.25 |
| 2025-09-12 | 0.23 |
| 2025-09-17 | -0.12 |
| 2025-09-19 | -0.38 |
| 2025-09-24 | -0.33 |
| 2025-09-26 | -0.54 |
| 2025-10-01 | -0.21 |
| 2025-10-06 | -0.87 |
| 2025-10-08 | -1.07 |
| 2025-10-13 | -1.07 |
| 2025-10-15 | -0.89 |
| 2025-10-20 | -1.02 |
| 2025-10-22 | -0.80 |
| 2025-10-27 | -0.72 |
| 2025-10-29 | -0.97 |
| 2025-11-03 | -1.24 |
| 2025-11-05 | -1.25 |
| 2025-11-10 | -1.41 |
| 2025-11-12 | -1.59 |
| 2025-11-17 | -1.65 |
| 2025-11-19 | -1.59 |
| 2025-11-24 | -1.58 |
| 2025-11-26 | -1.55 |
| 2025-12-02 | -1.66 |
| 2025-12-05 | -2.05 |
| 2025-12-09 | -2.01 |
| 2025-12-12 | -2.21 |
| 2025-12-16 | -2.13 |
| 2025-12-19 | -2.23 |
| 2025-12-23 | -2.27 |
| 2025-12-29 | -2.03 |
| 2025-12-31 | -1.87 |
| 2026-01-06 | -2.00 |
| 2026-01-08 | -2.13 |
| 2026-01-13 | -1.84 |
| 2026-01-15 | -1.64 |
| 2026-01-21 | -1.88 |
| 2026-01-23 | -2.00 |
| 2026-01-28 | -1.88 |
| 2026-01-30 | -1.51 |
| 2026-02-04 | -1.41 |
| 2026-02-09 | -1.25 |
| 2026-02-11 | -0.87 |
| 2026-02-17 | -0.51 |
| 2026-02-19 | -0.65 |
| 2026-02-24 | -0.70 |
| 2026-02-26 | -1.19 |
| 2026-03-03 | -1.33 |
| 2026-03-05 | -1.45 |
| 2026-03-10 | -1.61 |
| 2026-03-12 | -1.66 |
| 2026-03-17 | -1.56 |
| 2026-03-19 | -1.58 |
| 2026-03-24 | -1.65 |
| 2026-03-26 | -1.59 |
| 2026-03-31 | -1.69 |
| 2026-04-02 | -1.56 |
| 2026-04-08 | -1.22 |
| 2026-04-13 | -0.90 |
| 2026-04-15 | -1.05 |
| 2026-04-20 | -0.96 |
| 2026-04-22 | -1.46 |
| 2026-04-27 | -1.47 |
| 2026-04-29 | -1.23 |
| 2026-05-04 | -1.22 |
| 2026-05-06 | -1.01 |
| 2026-05-11 | -1.20 |
| 2026-05-13 | -0.97 |
| 2026-05-18 | -1.44 |
| 2026-05-20 | -1.26 |
| 2026-05-26 | -1.05 |
| 2026-05-28 | -0.65 |
| 2026-06-02 | -0.70 |
| 2026-06-04 | -0.93 |
| 2026-06-09 | -0.53 |
| 2026-06-12 | -0.56 |
| 2026-06-16 | -0.58 |
| 2026-06-22 | -0.60 |
| 2026-06-24 | -0.39 |
| 2026-06-29 | -0.52 |
| 2026-07-01 | -1.31 |
| 2026-07-07 | -1.61 |
| 2026-07-09 | -1.66 |
| 2026-07-14 | -1.87 |
| 2026-07-16 | -1.78 |
| 2026-07-21 | -1.88 |
| 2026-07-23 | -1.25 |
| 2026-07-28 | -1.77 |
| 2026-07-30 | -2.12 |
| 2026-08-04 | -2.77 |
| 2026-08-06 | -3.14 |
Stock-specific moves accounted for 94% of the day's cross-sectional variance against a 66% one-year average, and the single-name list is why: AppLovin -19.86% ($27.5 billion of market value gone), Datadog -18.97% after a beat-and-raise quarter that flagged a usage cut at its largest AI customer CNBC, TripAdvisor -25.53%, Insmed +33.13%, Paycom +23.83%. Honeywell Aerospace fell as much as 26% on a cut 2026 outlook it blamed on supply-chain constraints Economic Times — and the defense ETF that holds it gave up under a percent on twice its typical session pace. Airbnb closed the regular session -0.56%, then rose a further +11.75% in late trading after lifting its 2026 revenue and margin outlook for the second time this year Bloomberg.
Underneath that, realized style volatility of 29.5 vol points sits in the 96.8th percentile since 2020 while index volatility is 11.9 points, in the 22.7th — the axes a book actually loads on are churning under an index that barely moved, and realized correlation remains pinned near the lows it has held for weeks. Two style signals did carry: the most heavily shorted names underperformed the barely-shorted ones by -0.28% at z=-1.6, the model's durable direction holding through all this single-name noise, and unprofitable names outperformed at z=-1.2, led by the biotech end of the exposure and confirmed by XBI +1.27%.
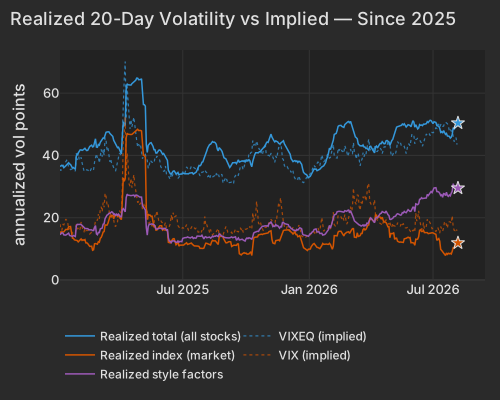
| Series | Today Vol Pts | Prev Close Vol Pts |
|---|---|---|
| total | 50.40 | 49.72 |
| market | 11.90 | 12.35 |
| style | 29.50 | 29.77 |
Energy was the exception to all of it — the one complex that moved together. The Oil factor rose +0.50% at z=+1.0 with the highest-exposure names carrying it, XLE closed +1.43% and the energy sector +1.84% behind Exxon +2.02% and Shell +2.13%. Reuters reported Thursday that an Iranian parliamentary committee is reviewing a bill barring U.S. and Israeli vessels from the Strait of Hormuz, which took crude up more than $3. Set against USO's -20.32% over the past 63 sessions, that is a risk headline landing on a badly beaten complex, not the start of a bid.
Initial Claims, released at 8:30 AM ET, showed applications up 1,000 to 199,000 for the week ending August 1, below the 202,000 consensus and a third straight week under 200,000, with the four-week average down 4,500 to 198,750 — the print that pushed the front end of the curve and September hike expectations higher. The Global Supply Chain Pressure Index, released at 10:00 AM ET, held at 1.25 in July, unchanged from June and well off the 1.81 peak set in May during the Strait of Hormuz shipping standstill; traders largely looked past it.
Variance decomposition: live intraday — 20260806 session, bracketed against its trailing-year range. Factor returns are trailing through last close. Total cross-sectional dispersion: 90.8%ile of the past year.
Variance mix — % of total, today vs 1d ago vs 1-yr avg
market 19%ile style 0.8%ile thematic 41%ile idiosyncratic 99.6%ile
Variance explained — today vs. factor's trailing-year range
Marker = the factor's share of today's total variance, placed in its own trailing-year range (box 25–75%ile, ticks 90%ile and max). Amber marker = unusually load-bearing today (≥90%ile of its own year). Factor name green = up today / red = down.
Correlation & dispersion — realized vs implied
Pairwise realized correlation (20d): 7.37% 1.9%ile since 2020 · 27%ile 3m
Top-500 pairwise: 10.25% 7.8%ile since 2020 · 48%ile 3m · implied (Cboe COR1M): 6.79 0.7%ile of its own history (gap +3.5pp)
Realized 20d vol (ann. pts): all stocks 50 vs VIXEQ 42 · index 12 vs VIX 15 · style factors 30 96.8%ile
20-day window (19 completed days + today); percentiles vs model history since 2020; '3m' tokens rank vs the trailing 63 trading days; definitions in Terms below. Implied prints (Cboe) are delayed ~15 min. as of 15:58 ET
High-beta momentum cohort (eq-wt, since-2020 rank): -0.1% 44%ile · rest of market -0.3%
| Factor | Today | 1d | 5d | 20d | 60d |
|---|---|---|---|---|---|
| Style-Risk | |||||
| International | +0.24% z+0.8 | +0.14% | -0.96% | +0.15% | -1.40% |
| Beta | -0.50% z-0.5 | -0.35% | +3.00% | -3.56% | -4.30% |
| Residual Volatility | +0.02% z+0.1 | -0.56% | +0.85% | -0.50% | -1.62% |
| Style | |||||
| Profitability | -0.23% z-1.2 | -0.03% | -0.43% | +0.26% | -0.84% |
| Value | -0.22% z-0.9 | -0.28% | -0.10% | +0.84% | -0.60% |
| Liquidity | -0.21% z-0.8 | -0.42% | -0.23% | -0.19% | -2.22% |
| Leverage | -0.13% z-0.8 | -0.24% | -1.02% | -1.48% | -1.94% |
| Size | +0.17% z+0.5 | +0.14% | +0.52% | -0.17% | -0.86% |
| Growth | -0.10% z-0.4 | +0.32% | +0.50% | +0.60% | +3.05% |
| Dividend Yield | +0.01% z+0.0 | -0.10% | -0.10% | -0.25% | -1.16% |
| Style-Momentum | |||||
| One-Day Momentum | -0.28% z-1.0 | -0.31% | -0.21% | +0.54% | +3.73% |
| Medium-Term Momentum | -0.26% z-0.9 | +0.35% | -0.29% | -0.23% | +1.35% |
| Short-Term Momentum | +0.21% z+0.7 | -0.78% | -1.43% | -5.56% | -8.27% |
| Long-Term Momentum | +0.03% z+0.0 | -0.51% | -1.85% | -4.56% | -5.72% |
| Style-Positioning | |||||
| Short Interest | -0.28% z-1.6 | -0.11% | -0.28% | -0.87% | +1.24% |
| Hedge-Fund Ownership | +0.01% z+0.1 | +0.12% | +0.12% | -0.10% | +0.01% |
| Style-Flow | |||||
| Morning Activity | -0.11% z-0.9 | +0.22% | +0.19% | +0.53% | -0.47% |
| Short-Sale Activity | -0.06% z-0.6 | -0.05% | +0.18% | +0.23% | -0.25% |
| Thematic | |||||
| Oil | +0.50% z+1.0 | -0.45% | +0.30% | +0.13% | -2.94% |
| Semiconductors | +0.57% z+0.9 | -0.82% | -0.76% | -3.45% | -5.97% |
| China | +0.26% z+0.7 | -0.28% | +0.30% | +1.25% | -3.03% |
| Gold | +0.16% z+0.5 | +0.67% | +0.02% | +1.04% | -3.80% |
| Treasury (Duration) | -0.16% z-0.5 | +0.32% | -0.42% | +1.30% | +0.56% |
| Bitcoin / Crypto | +0.08% z+0.3 | -0.11% | -0.71% | -0.91% | -1.27% |
5/20/60d windows include today's session; 1d is the previous session.
Pairwise realized correlation. Index variance net of the weighted idiosyncratic diagonal, over the cross terms — the estimator used for implied-correlation indices. 20-day window unless noted; history since 2020.
Market variance share. The fraction of cross-sectional variance explained by the market factor — the attribution companion to pairwise correlation, not a substitute for it.
Factor z-score. Today's factor return divided by its daily-return standard deviation over ~1,600 trading days.
Conditional importance. A factor's relative share of what a tree-based fit of today's stock returns explains; sums to 100% across factors.
High-beta momentum cohort. US names above $2B market cap in the top quintile of both raw beta and 12-month momentum; membership frozen at each month's first business day. “Top 50” = the 50 strongest by combined rank.
Dispersion (realized). Total cross-sectional volatility net of the market component; high dispersion is the flip side of low correlation.
Stock-specific (idiosyncratic) return. The part of a stock's move not explained by market, style, or thematic factors in our decomposition.
VIXEQ / DSPX / COR1M. Cboe implied indices: single-stock volatility, dispersion, and 1-month implied correlation (top-50 S&P names). Quotes delayed ~15 minutes.
Data compiled by FactorPulse AI; edited and verified by Jeff Klein. For informational purposes only. Does not constitute financial advice, an investment recommendation, or an offer to buy or sell any securities. Always consult a qualified financial professional before making investment decisions.
For more on factor construction methodology, see www.factorpulse.com/glossary.