JPMorgan Prime Services logged July as the most pronounced hedge-fund de-grossing since 2022, with assets in leveraged ETFs tracking Samsung and SK Hynix collapsing from $50 billion in late June to $17 billion in the week ending August 1, and the desk now reads the reduction in semiconductor exposure as largely completeBloomberg. The mechanical case for that is strong: Citadel absorbed roughly $16 billion of Situational Awareness's public book at about a 10% discount on July 30, taking the forced seller out of the marketWSJ. Our direct lens on the book claim agrees on direction — Hedge-Fund Ownership is +0.07% today at z=+0.6, and on a raw basis the more hedge-fund-owned names have added +0.72% over five sessions at z=+2.2. Short Interest settles the mechanism: at -0.19% and z=-1.1 the most heavily shorted names underperformed again, so the five-day bounce in high-beta names was not short-covering.
| Factor | Return | Z-Score | 5d Z | 20d Z | 63d Z | Category | Direction |
|---|---|---|---|---|---|---|---|
| Gold | +0.60% | z=+1.9 | -0.2 | +0.5 | -1.0 | Thematic | High-exposure miners led |
| Morning Activity | +0.25% | z=+2.0 | +2.1 | +1.1 | -0.1 | Style-Flow | Habitually morning-heavy names led |
| Growth | +0.43% | z=+1.8 | +0.9 | +0.8 | +1.5 | Style | Fast-growth names led |
| Short-Term Momentum | -0.70% | z=-2.2 | -4.0 | -4.0 | -3.4 | Style-Momentum | Recent multi-day winners gave back |
| Treasury (Duration) | +0.37% | z=+1.1 | -0.5 | +0.9 | +0.3 | Thematic | Duration-sensitive names led |
| Short Interest | -0.19% | z=-1.1 | -2.2 | -1.0 | +1.0 | Style-Positioning | Most-shorted names lagged |
| Hedge-Fund Ownership | +0.07% | z=+0.6 | +0.1 | -0.3 | -0.7 | Style-Positioning | HF-owned names marginally ahead |
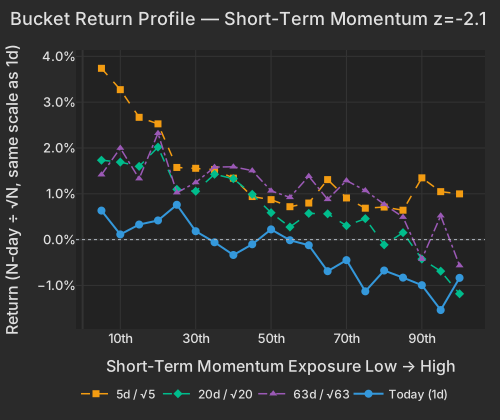
Short-Term Momentum is the active fault line. Every horizon carries the same sign as today: -2.93% over five sessions, -5.76% over 20, -8.31% over 60, four down days in the last five, and 3.1% of today's cross-sectional variance — a top-decile load for that factor. The cross-section is cleanly ordered: the week's strongest multi-day performers made up the day's worst bucket at -0.82% while the weakest made the best at +1.78%. A 20-day run at z=-4.0 and a 63-day at z=-3.4 spanning a documented de-grossing episode is indicative of hedge-fund deleveraging and releveraging churn, and reversion of this kind runs hardest when single-stock volatility is elevated — which it still is.
| Bucket | Ret 1D Pct | Ret 5D Norm Pct | Ret 20D Norm Pct | Ret 63D Norm Pct |
|---|---|---|---|---|
| 1 | 0.63 | 3.74 | 1.73 | 1.42 |
| 2 | 0.11 | 3.27 | 1.69 | 2.00 |
| 3 | 0.33 | 2.67 | 1.60 | 1.33 |
| 4 | 0.42 | 2.53 | 2.02 | 2.32 |
| 5 | 0.76 | 1.57 | 1.10 | 1.02 |
| 6 | 0.18 | 1.56 | 1.06 | 1.25 |
| 7 | -0.06 | 1.53 | 1.43 | 1.58 |
| 8 | -0.34 | 1.34 | 1.33 | 1.59 |
| 9 | -0.10 | 0.94 | 0.99 | 1.51 |
| 10 | 0.22 | 0.87 | 0.59 | 1.06 |
| 11 | -0.01 | 0.72 | 0.27 | 0.92 |
| 12 | -0.12 | 0.80 | 0.57 | 1.38 |
| 13 | -0.69 | 1.31 | 0.56 | 0.88 |
| 14 | -0.45 | 0.91 | 0.30 | 1.29 |
| 15 | -1.13 | 0.69 | 0.46 | 1.07 |
| 16 | -0.67 | 0.71 | -0.11 | 0.77 |
| 17 | -0.83 | 0.64 | 0.15 | 0.49 |
| 18 | -0.99 | 1.35 | -0.42 | -0.43 |
| 19 | -1.54 | 1.05 | -0.69 | 0.52 |
| 20 | -0.84 | 1.00 | -1.18 | -0.57 |
The recovery leg is real and it was a beta event. Beta has returned +8.12% over five sessions while sitting at z=+0.0 today, and it explained 21.8% of five-day cross-sectional variance, the 98.5th percentile since 2020 — the past week's cross-section was organized almost entirely along the beta axis. The ETF trail says the same thing: software, semiconductors and technology all put up 8–11% over five days off deeply negative 20-day marks. Arista +6.41% is the cleanest evidence that AI hardware is trading on fundamentals again, adding $15.4B after a first $3 billion quarter and a third guidance raise to about $12.6 billionMarketWatch.
The participation behind it is thinner than the prices suggest. In yesterday's session the top 50 high-beta momentum names traded on light volume, below the broad market's pace, and the easiest-to-trade names led the buying (+8.55% for the high-turnover third against +2.29% for the middle) — the volume is not indicative of a strong releveraging. Today that same group is -1.55% against -0.24% for everything else, off a drawdown that stood at -15.1% through yesterday's close for the wider high-beta momentum group. The options market is priced for the dislocation to persist: implied dispersion (Cboe DSPX) at 40.8 is in the 98.2nd percentile of its own history, and VIXEQ at 43.7 has barely come in while VIX at 15.8 sits below its long-run middle. Forced selling looks finished; the episode does not.
| ETF | Theme | Today | 1d Ago | 5d Ago | 20d Ago | 63d Ago |
|---|---|---|---|---|---|---|
| GDX | gold miners | +6.71% | +2.46% | +5.00% | +2.85% | -9.03% |
| GLD | gold | +4.46% | +0.66% | +1.30% | -0.88% | -9.78% |
| SLV | silver | +4.45% | +2.63% | +4.14% | -1.14% | -18.35% |
| IGV | software | -0.23% | +4.70% | +11.14% | +8.36% | +15.33% |
| SMH | semiconductors | +0.01% | +5.55% | +8.71% | -0.99% | +13.60% |
| XLK | technology | +0.35% | +4.98% | +9.24% | +4.31% | +15.33% |
| XLE | energy | -1.65% | -0.46% | +1.65% | +7.10% | -1.46% |
| XOP | oil E&P | -2.70% | -1.34% | +3.35% | +9.27% | -5.01% |
| USO | crude oil | -0.69% | -5.19% | -3.91% | +6.30% | -21.56% |
| VXX | volatility futures | -3.23% | +0.90% | -3.45% | -1.94% | -25.81% |
Spot gold ran nearly 4% to $4,233.89 an ounce — its biggest one-day advance since February — and silver 3.5% to $61.68 as the market cut September Fed hike odds to 57% from 67%, with WTI sliding toward $74NYT. The supply leg is the US, Iran and Oman preparing a 60-day framework for shipping through the Strait of HormuzBloomberg. Our Gold factor prints +0.60% at z=+1.9 with the largest conditional importance in today's factor set at 23% and a return in the 99.3rd percentile since 2020; the top-exposure bucket gained +2.32% and Materials topped the sector medians at +1.26% behind AEM +8.79% and NEM +6.54%. Index volatility fell on the session (VIX 15.76 from 16.50), so the metal is tracking the rate path rather than hedging demand.
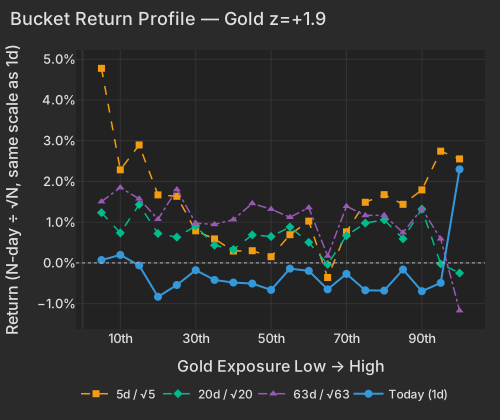
| Bucket | Ret 1D Pct | Ret 5D Norm Pct | Ret 20D Norm Pct | Ret 63D Norm Pct |
|---|---|---|---|---|
| 1 | 0.07 | 4.78 | 1.23 | 1.50 |
| 2 | 0.20 | 2.29 | 0.74 | 1.85 |
| 3 | -0.06 | 2.90 | 1.43 | 1.57 |
| 4 | -0.83 | 1.67 | 0.72 | 1.07 |
| 5 | -0.54 | 1.64 | 0.63 | 1.80 |
| 6 | -0.18 | 0.79 | 0.91 | 0.98 |
| 7 | -0.42 | 0.59 | 0.43 | 0.94 |
| 8 | -0.48 | 0.29 | 0.33 | 1.06 |
| 9 | -0.51 | 0.30 | 0.69 | 1.46 |
| 10 | -0.66 | 0.15 | 0.65 | 1.32 |
| 11 | -0.14 | 0.69 | 0.88 | 1.12 |
| 12 | -0.20 | 1.03 | 0.50 | 1.36 |
| 13 | -0.65 | -0.36 | -0.03 | 0.17 |
| 14 | -0.27 | 0.76 | 0.67 | 1.39 |
| 15 | -0.67 | 1.49 | 0.98 | 1.17 |
| 16 | -0.68 | 1.68 | 1.06 | 1.17 |
| 17 | -0.16 | 1.44 | 0.59 | 0.74 |
| 18 | -0.69 | 1.79 | 1.32 | 1.33 |
| 19 | -0.49 | 2.74 | -0.03 | 0.59 |
| 20 | 2.30 | 2.55 | -0.25 | -1.17 |
The curve did less than the metal implies. The 10-year at 4.615% is down 1.2 bps and the 30-year at 5.167% down 2.2 bpsCNBC, with the dollar index at 99.66, off -0.20%CNBC. Treasury (Duration) at +0.37% and z=+1.1 confirms duration-sensitive names outperformed, but a two-basis-point move in the long bond does not pay for a 4% day in bullion — the gold trade is discounting the Fed path Friday's payrolls will test, not today's yields. On the other side of the Hormuz framework, Energy's median stock fell -1.36% with EOG -5.70% after its report, and the oil complex's 20-day gains are where the give-back is coming from.
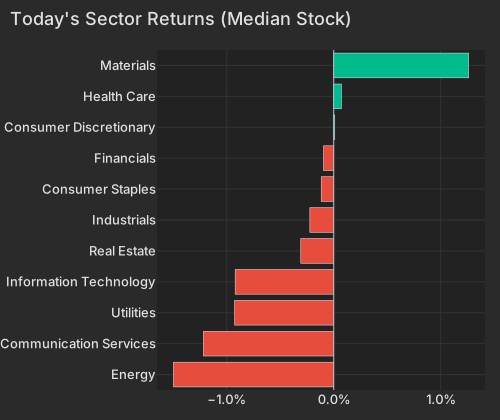
| Sector | Median Ret Pct |
|---|---|
| Energy | -1.50 |
| Communication Services | -1.22 |
| Utilities | -0.93 |
| Information Technology | -0.92 |
| Real Estate | -0.31 |
| Industrials | -0.22 |
| Consumer Staples | -0.12 |
| Financials | -0.10 |
| Consumer Discretionary | 0.01 |
| Health Care | 0.07 |
| Materials | 1.26 |
Idiosyncratic moves account for 86% of today's cross-sectional variance against a 67% one-year average, and the index leg is 0.3% — the second earnings-heavy session running where names are priced one at a time. Shopify +18.9% is almost all its own move, adding $31.8B on a 34% revenue increase to $3.58B and a low-thirties third-quarter guideEconomic Times. Eli Lilly +3.93% added $38.9B on a 48% revenue jump to $22.97B and raised guidanceCNBC, and with Shopify and Nvidia it carried Growth to +0.43% at z=+1.8 while the lowest-growth bucket fell -1.18%. The downside was just as name-specific: Insulet -20.8% on a cut to full-year revenue guidanceBloomberg, the New York Times -15.2% despite revenue rising 11%NYT, Uber -6.5% on soft forward guidanceBloomberg, and Materion +28.4%, the largest stock-specific move in the universe, on a Q2 beat and record marginsBloomberg. AMD is the name that matters for the deleveraging question: -6.06% and $54.9B erased on a quarter that beat, with third-quarter guidance of $13 billion above the $12.5 billion consensus but short of buy-side whispersBloombergCNBC. Nvidia +4.58% added $241B on its SpaceX AI data-center tie-upNYT. Same complex, opposite marks, no factor doing the work.
The ADP adpemploymentreport.com National Employment Report, released at 8:15 AM ET, showed private payrolls up just 44,000 in July against consensus estimates near 70,000, with small businesses posting net job losses; Treasury yields fell on the print as rate-cut pricing firmed. The ISM Services index, released at 10:00 AM ET, came in at 54.1 — a third consecutive month of expansion but below expectations, with New Orders holding above 50 while the Employment index slipped into contraction at 47.4. Friday's non-farm payrolls is the resolution point: the ADP miss is the reason the September hike is now a coin flip, and it is the number the gold surge is leaning on.
Variance decomposition: live intraday — 20260805 session, bracketed against its trailing-year range. Factor returns are trailing through last close. Total cross-sectional dispersion: 66%ile of the past year.
Variance mix — % of total, today vs 1d ago vs 1-yr avg
market 16%ile style 25%ile thematic 75%ile idiosyncratic 85%ile
Variance explained — today vs. factor's trailing-year range
Marker = the factor's share of today's total variance, placed in its own trailing-year range (box 25–75%ile, ticks 90%ile and max). Amber marker = unusually load-bearing today (≥90%ile of its own year). Factor name green = up today / red = down.
Correlation & dispersion — realized vs implied
Pairwise realized correlation (20d): 8.06% 3.1%ile since 2020 · 35%ile 3m
Top-500 pairwise: 10.67% 8.6%ile since 2020 · 54%ile 3m · implied (Cboe COR1M): 6.97 0.8%ile of its own history (gap +3.7pp)
Realized 20d vol (ann. pts): all stocks 50 vs VIXEQ 44 · index 12 vs VIX 16 · style factors 30 97.4%ile
20-day window (19 completed days + today); percentiles vs model history since 2020; '3m' tokens rank vs the trailing 63 trading days; definitions in Terms below. Implied prints (Cboe) are delayed ~15 min. as of 14:21 ET
Top 50 high-beta momentum names (eq-wt, since-2020 rank): -1.6% 23%ile · rest of market -0.2%
| Factor | Today | 1d | 5d | 20d | 60d |
|---|---|---|---|---|---|
| Style-Risk | |||||
| Residual Volatility | -0.43% z-0.8 | +0.76% | +1.74% | -0.27% | -1.07% |
| International | +0.16% z+0.5 | -0.48% | -0.79% | -0.12% | -1.59% |
| Beta | +0.03% z+0.0 | +2.20% | +8.12% | -1.07% | -2.77% |
| Style | |||||
| Growth | +0.43% z+1.8 | +0.07% | +0.48% | +0.88% | +3.10% |
| Liquidity | -0.37% z-1.3 | +0.33% | +1.41% | -0.16% | -1.70% |
| Leverage | -0.22% z-1.2 | -0.22% | -1.03% | -1.43% | -1.80% |
| Value | -0.25% z-1.1 | -0.11% | -0.15% | +1.21% | -0.85% |
| Profitability | +0.07% z+0.3 | +0.13% | -0.25% | +0.63% | -0.51% |
| Size | +0.12% z+0.3 | -0.23% | +0.56% | -0.57% | -0.78% |
| Dividend Yield | -0.02% z-0.1 | +0.14% | +0.14% | -0.20% | -0.66% |
| Style-Momentum | |||||
| Short-Term Momentum | -0.70% z-2.1 | -0.46% | -2.93% | -5.76% | -8.31% |
| One-Day Momentum | -0.39% z-1.4 | -0.25% | -0.70% | +0.47% | +4.22% |
| Medium-Term Momentum | +0.33% z+1.1 | -0.13% | -0.21% | +0.17% | +1.52% |
| Long-Term Momentum | -0.14% z-0.2 | +0.02% | +0.45% | -4.03% | -3.53% |
| Style-Positioning | |||||
| Short Interest | -0.19% z-1.1 | +0.35% | -0.82% | -0.75% | +1.05% |
| Hedge-Fund Ownership | +0.07% z+0.6 | -0.12% | +0.02% | -0.14% | -0.21% |
| Style-Flow | |||||
| Morning Activity | +0.25% z+2.0 | +0.00% | +0.59% | +0.62% | +0.10% |
| Short-Sale Activity | -0.01% z-0.1 | +0.28% | +0.15% | +0.17% | -0.19% |
| Thematic | |||||
| Gold | +0.60% z+1.9 | +0.24% | -0.17% | +0.68% | -3.43% |
| Treasury (Duration) | +0.37% z+1.1 | -0.23% | -0.36% | +1.36% | +0.75% |
| China | -0.35% z-0.9 | +0.11% | -0.55% | +0.82% | -3.41% |
| Semiconductors | -0.42% z-0.7 | +0.51% | +1.23% | -3.33% | -5.05% |
| Oil | -0.21% z-0.4 | -0.26% | +0.96% | -0.36% | -1.80% |
| Bitcoin / Crypto | -0.05% z-0.2 | -0.05% | -0.09% | -1.03% | -0.97% |
5/20/60d windows include today's session; 1d is the previous session.
Factor z-score. Today's factor return divided by its daily-return standard deviation over ~1,600 trading days.
High-beta momentum cohort. US names above $2B market cap in the top quintile of both raw beta and 12-month momentum; membership frozen at each month's first business day. “Top 50” = the 50 strongest by combined rank.
Dispersion (realized). Total cross-sectional volatility net of the market component; high dispersion is the flip side of low correlation.
Stock-specific (idiosyncratic) return. The part of a stock's move not explained by market, style, or thematic factors in our decomposition.
VIXEQ / DSPX / COR1M. Cboe implied indices: single-stock volatility, dispersion, and 1-month implied correlation (top-50 S&P names). Quotes delayed ~15 minutes.
Data compiled by FactorPulse AI; edited and verified by Jeff Klein. For informational purposes only. Does not constitute financial advice, an investment recommendation, or an offer to buy or sell any securities. Always consult a qualified financial professional before making investment decisions.
For more on factor construction methodology, see www.factorpulse.com/glossary.