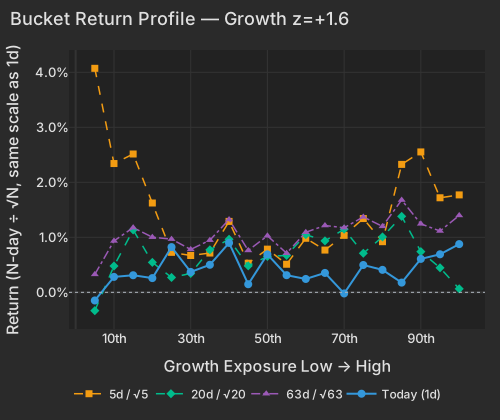
| Factor | Return | Z-Score | 5d Z | 20d Z | 63d Z | Category | Direction |
|---|---|---|---|---|---|---|---|
| Growth | +0.39% | z=+1.6 | +0.8 | +0.8 | +1.4 | Style | Faster-growing names led |
| Morning Activity | +0.17% | z=+1.3 | +1.8 | +0.9 | -0.2 | Style-Flow | Habitually morning-heavy names led |
| Gold | +0.38% | z=+1.2 | -0.5 | +0.3 | -1.1 | Thematic | Gold-exposed names led |
| Short-Sale Activity | -0.12% | z=-1.1 | +0.2 | +0.1 | -0.1 | Style-Flow | Barely short-sold names beat the most heavily short-sold |
| Leverage | -0.19% | z=-1.1 | -2.5 | -1.8 | -1.3 | Style | More-levered names lagged |
| Liquidity | -0.29% | z=-1.0 | +2.4 | -0.1 | -0.8 | Style | Lowest-turnover names beat the most liquid |
| Short-Term Momentum | -0.18% | z=-0.6 | -3.3 | -3.6 | -3.2 | Style-Momentum | Last week's winners gave back to recent losers |
| Bucket | Ret 1D Pct | Ret 5D Norm Pct | Ret 20D Norm Pct | Ret 63D Norm Pct |
|---|---|---|---|---|
| 1 | -0.15 | 4.07 | -0.33 | 0.33 |
| 2 | 0.28 | 2.34 | 0.48 | 0.93 |
| 3 | 0.31 | 2.52 | 1.13 | 1.18 |
| 4 | 0.26 | 1.62 | 0.54 | 1.00 |
| 5 | 0.82 | 0.73 | 0.27 | 0.97 |
| 6 | 0.37 | 0.67 | 0.34 | 0.78 |
| 7 | 0.50 | 0.71 | 0.77 | 0.95 |
| 8 | 0.90 | 1.29 | 0.96 | 1.32 |
| 9 | 0.15 | 0.53 | 0.48 | 0.76 |
| 10 | 0.69 | 0.79 | 0.65 | 1.03 |
| 11 | 0.31 | 0.51 | 0.67 | 0.71 |
| 12 | 0.24 | 0.98 | 1.05 | 1.09 |
| 13 | 0.35 | 0.77 | 0.94 | 1.21 |
| 14 | -0.02 | 1.04 | 1.15 | 1.17 |
| 15 | 0.50 | 1.34 | 0.71 | 1.37 |
| 16 | 0.41 | 0.92 | 1.01 | 1.20 |
| 17 | 0.18 | 2.33 | 1.38 | 1.68 |
| 18 | 0.61 | 2.55 | 0.74 | 1.24 |
| 19 | 0.69 | 1.72 | 0.45 | 1.11 |
| 20 | 0.88 | 1.77 | 0.06 | 1.40 |
Shopify is the loudest print. Its Growth exposure is +2.6σ, but its Short-Term Momentum exposure is -2.7σ: it came into today among the past week's worst multi-day laggards. Eli Lilly has the same shape — Growth +2.8σ, Short-Term Momentum -1.7σ — and is +4.87% after revenue rose 48% to $23.0 billion and management lifted full-year guidance to $85–87 billionCNBC, with its style leg contributing 1.5 points of the move, the 91st percentile of its own trailing year. Arista Networks, which reported after yesterday's close, is +11.26% with 10.4 points of that stock-specific; Dynatrace +10.26%; Kennametal +14.56%. Software has been the receiving end of this all week — IGV +11.14% over five sessions inside the $3.5 trillion the Nasdaq 100 added over four daysBloomberg.
That pairing — growth rewarded in recently-sold names — is the month's real signal. Short-Term Momentum is only -0.18% today (z=-0.6), but it has run -5.24% over 20 sessions and -7.79% over 60, at z=-3.59 and z=-3.16. This is strongly indicative of the deleveraging/releveraging in the hedge fund space that has been creating extreme short-term reversal patterns. Reversion is strongest after periods of stress when single-stock volatility is unusually high. Recent multi-day winners have been handing money to recent multi-day losers for a month without interruption, and today extends it rather than breaking it. MTUM tells the same story from the outside: +7.19% over five days, +0.29% over 20, +10.22% over 63 — a big week that has bought nothing over the month.
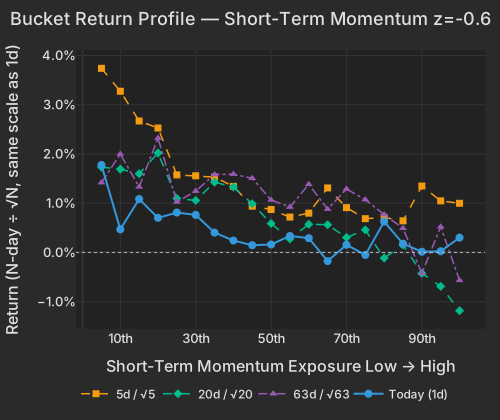
| Bucket | Ret 1D Pct | Ret 5D Norm Pct | Ret 20D Norm Pct | Ret 63D Norm Pct |
|---|---|---|---|---|
| 1 | 1.78 | 3.74 | 1.73 | 1.42 |
| 2 | 0.47 | 3.27 | 1.69 | 2.00 |
| 3 | 1.08 | 2.67 | 1.60 | 1.33 |
| 4 | 0.70 | 2.53 | 2.02 | 2.32 |
| 5 | 0.81 | 1.57 | 1.10 | 1.02 |
| 6 | 0.76 | 1.56 | 1.06 | 1.25 |
| 7 | 0.40 | 1.53 | 1.43 | 1.58 |
| 8 | 0.24 | 1.34 | 1.33 | 1.59 |
| 9 | 0.15 | 0.94 | 0.99 | 1.51 |
| 10 | 0.16 | 0.87 | 0.59 | 1.06 |
| 11 | 0.33 | 0.72 | 0.27 | 0.92 |
| 12 | 0.29 | 0.80 | 0.57 | 1.38 |
| 13 | -0.17 | 1.31 | 0.56 | 0.88 |
| 14 | 0.16 | 0.91 | 0.30 | 1.29 |
| 15 | -0.05 | 0.69 | 0.46 | 1.07 |
| 16 | 0.63 | 0.71 | -0.11 | 0.77 |
| 17 | 0.18 | 0.64 | 0.15 | 0.49 |
| 18 | 0.01 | 1.35 | -0.42 | -0.43 |
| 19 | 0.02 | 1.05 | -0.69 | 0.52 |
| 20 | 0.30 | 1.00 | -1.18 | -0.57 |
AMD's total revenue rose 50% and data-center sales doubled, and its Q3 guide of $13 billion cleared the $12.5 billion consensus without clearing the whisper — the stock is -8.56%, 8.5 points of it its own moveBloomberg. CDW is -21.00% after margin compression and its CFO's retirement announcement overshadowed a beatBloomberg, and Insulet is -10.81% after trimming full-year revenue guidance despite beating on the quarterBloomberg — a high-growth name with +2.1σ Growth exposure that the factor did nothing to protect. The hardware side of the AI trade is where the cooling shows up in instruments: DRAM -3.28% after +14.90% over five sessions, SMH -0.95% against +8.71%, and the Semiconductors factor -0.55% today on top of -3.47% over 20 days. Delivered growth is being paid; the capex bill is not.
| ETF | Theme | Today | 1d Ago | 5d Ago | 20d Ago | 63d Ago |
|---|---|---|---|---|---|---|
| GDX | gold miners | +4.99% | +2.46% | +5.00% | +2.85% | -9.03% |
| SLV | silver | +4.32% | +2.63% | +4.14% | -1.14% | -18.35% |
| GLD | gold | +2.91% | +0.66% | +1.30% | -0.88% | -9.78% |
| IGV | software | +1.45% | +4.70% | +11.14% | +8.36% | +15.33% |
| XLV | healthcare | +1.08% | -0.09% | -3.08% | -1.42% | +12.00% |
| SPY | large cap | +0.45% | +1.80% | +4.11% | +3.16% | +7.43% |
| MTUM | momentum | -0.53% | +3.83% | +7.19% | +0.29% | +10.22% |
| SMH | semiconductors | -0.95% | +5.55% | +8.71% | -0.99% | +13.60% |
| EWY | south korea | -1.69% | +6.80% | +13.00% | -5.60% | +4.62% |
| DRAM | memory chips & storage | -3.28% | +7.35% | +14.90% | -9.41% | +29.24% |
Gold is the only factor today doing genuinely independent work in the risk model, at 40% conditional importance: +0.38%, z=+1.18, with the highest-exposure names up 2.7% as a group. GDX +4.99%, SLV +4.32%, GLD +2.91%; Newmont +4.36% and Agnico +4.51% put the Materials median at +1.97%. The mechanism is the rate path, not fear. President Trump said a deal to reopen the Strait of Hormuz could be agreed within 48 hoursBloomberg, which takes energy-driven inflation out of the front end of expectations: the 20-year yield is down 2.6 bps to 5.159% and the 30-year down 2.5 bps to 5.164% while the 2-year is up 1.4 bps to 4.208%CNBC, and the dollar is -0.16% at 99.70CNBC. Crude declines to cooperate — USO is +0.51% today after -5.19% yesterday, with Bloomberg reporting Wednesday that Houthi threats against Saudi vessels in the Red Sea revived supply concerns, and RBC flagging downside risk to prices the same morningNYT.
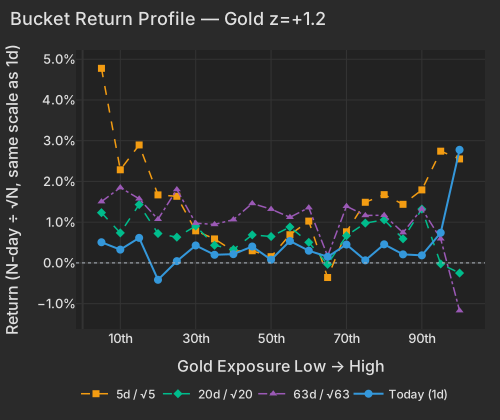
| Bucket | Ret 1D Pct | Ret 5D Norm Pct | Ret 20D Norm Pct | Ret 63D Norm Pct |
|---|---|---|---|---|
| 1 | 0.51 | 4.78 | 1.23 | 1.50 |
| 2 | 0.33 | 2.29 | 0.74 | 1.85 |
| 3 | 0.61 | 2.90 | 1.43 | 1.57 |
| 4 | -0.41 | 1.67 | 0.72 | 1.07 |
| 5 | 0.04 | 1.64 | 0.63 | 1.80 |
| 6 | 0.43 | 0.79 | 0.91 | 0.98 |
| 7 | 0.20 | 0.59 | 0.43 | 0.94 |
| 8 | 0.21 | 0.29 | 0.33 | 1.06 |
| 9 | 0.40 | 0.30 | 0.69 | 1.46 |
| 10 | 0.08 | 0.15 | 0.65 | 1.32 |
| 11 | 0.54 | 0.69 | 0.88 | 1.12 |
| 12 | 0.30 | 1.03 | 0.50 | 1.36 |
| 13 | 0.15 | -0.36 | -0.03 | 0.17 |
| 14 | 0.45 | 0.76 | 0.67 | 1.39 |
| 15 | 0.06 | 1.49 | 0.98 | 1.17 |
| 16 | 0.46 | 1.68 | 1.06 | 1.17 |
| 17 | 0.21 | 1.44 | 0.59 | 0.74 |
| 18 | 0.19 | 1.79 | 1.32 | 1.33 |
| 19 | 0.74 | 2.74 | -0.03 | 0.59 |
| 20 | 2.78 | 2.55 | -0.25 | -1.17 |
Index volatility is ordinary: the VIX at 16.66 sits in the 43.9th percentile of its own history. Everything underneath it is not. Implied single-stock volatility is 45.73, the 95.8th percentile, and implied dispersion is 42.68, the 98.7th. Realized data says the same thing over the past 20 sessions — style variance of 29.6 vol points, 97.4th percentile since 2020, against index variance of 12.4 points at the 26.5th, with Beta alone accounting for 23.1 of those points at the 98.4th percentile. Realized pairwise correlation remains pinned near the lows it set weeks ago at 9.33%, the 5.0th percentile since 2020, though the 5-day gauge at 17.86% is back in the 87.3rd percentile of the past three months. Single stocks are still setting their own prices; the index is barely being consulted.
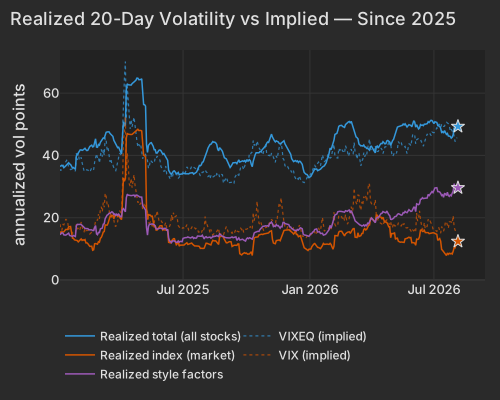
| Series | Today Vol Pts | Prev Close Vol Pts |
|---|---|---|
| total | 49.30 | 49.49 |
| market | 12.40 | 12.59 |
| style | 29.60 | 29.92 |
The positioning story running alongside this is a claim worth testing. JPMorgan called July's deleveraging the most pronounced since 2022, and in a note published Monday its strategists said hedge funds have largely finished cutting semiconductor exposure and are buying the dip; Morgan Stanley's sector-neutral momentum index fell 17.4% across four sessions in the late-July move. Our nearest comparable window agrees on direction, not magnitude: Long-Term Momentum is -4.22% over 20 sessions and Short-Term Momentum -5.24%. The ownership lens is where the buying claim gets its answer — Hedge-Fund Ownership is flat today at z=+0.39, but on a raw basis it ran z=+2.22 over the past five sessions, so the names hedge funds hold did outperform last week. Citadel's absorption of Situational Awareness's $16 billion public book on July 30 took the forced seller out of the pictureWSJ. What has not come back is participation: the top 50 high-beta momentum names, which acted as the proxy for the late-July de-risking, rose in yesterday's session on light volume at roughly three-quarters of the market's pace, gains concentrated in the easiest-to-trade names. That is not indicative of a strong releveraging.
The ADP adpemploymentreport.com National Employment Report is due at 8:15 AM ET, with consensus looking for 160,000–175,000 private-sector jobs; the risk that matters for the long end today is an upside surprise that hardens Fed expectations just as the 30-year prices a Hormuz deal. The ISM Services PMI follows at 10:00 AM ET, consensus 54.5 against June's 54.0, with the Prices Paid index — 67.7 in the prior reading — the line to watch for anyone holding the lower-rate-path trade that gold and silver are expressing this morning.
Variance decomposition: live intraday — 20260805 session, bracketed against its trailing-year range. Factor returns are trailing through last close. Total cross-sectional dispersion: 34%ile of the past year.
Variance mix — % of total, today vs 1d ago vs 1-yr avg
market 45%ile style 14%ile thematic 53%ile idiosyncratic 86%ile
Variance explained — today vs. factor's trailing-year range
Marker = the factor's share of today's total variance, placed in its own trailing-year range (box 25–75%ile, ticks 90%ile and max). Amber marker = unusually load-bearing today (≥90%ile of its own year). Factor name green = up today / red = down.
Correlation & dispersion — realized vs implied
Pairwise realized correlation (20d): 9.33% 5.0%ile since 2020 · 52%ile 3m
Top-500 pairwise: 11.60% 10%ile since 2020 · 60%ile 3m · implied (Cboe COR1M): 7.19 0.9%ile of its own history (gap +4.4pp)
Realized 20d vol (ann. pts): all stocks 49 vs VIXEQ 46 · index 12 vs VIX 17 · style factors 30 97.4%ile
20-day window (19 completed days + today); percentiles vs model history since 2020; '3m' tokens rank vs the trailing 63 trading days; definitions in Terms below. Implied prints (Cboe) are delayed ~15 min. as of 07:58 ET
Top 50 high-beta momentum names (eq-wt, since-2020 rank): -1.1% 30%ile · rest of market +0.3%
| Factor | Today | 1d | 5d | 20d | 60d |
|---|---|---|---|---|---|
| Style-Risk | |||||
| International | +0.13% z+0.4 | -0.48% | -0.82% | -0.16% | -1.63% |
| Beta | -0.20% z-0.2 | +2.20% | +7.89% | -1.30% | -2.99% |
| Residual Volatility | +0.02% z+0.1 | +0.76% | +2.19% | +0.18% | -0.61% |
| Style | |||||
| Growth | +0.39% z+1.6 | +0.07% | +0.44% | +0.84% | +3.07% |
| Leverage | -0.19% z-1.1 | -0.22% | -1.00% | -1.39% | -1.76% |
| Liquidity | -0.29% z-1.0 | +0.33% | +1.48% | -0.08% | -1.63% |
| Profitability | -0.12% z-0.6 | +0.13% | -0.43% | +0.44% | -0.69% |
| Value | -0.12% z-0.5 | -0.11% | -0.03% | +1.33% | -0.72% |
| Size | +0.09% z+0.2 | -0.23% | +0.53% | -0.60% | -0.81% |
| Dividend Yield | -0.02% z-0.1 | +0.14% | +0.13% | -0.21% | -0.67% |
| Style-Momentum | |||||
| One-Day Momentum | -0.21% z-0.7 | -0.25% | -0.52% | +0.65% | +4.40% |
| Short-Term Momentum | -0.18% z-0.6 | -0.46% | -2.41% | -5.24% | -7.79% |
| Long-Term Momentum | -0.32% z-0.5 | +0.02% | +0.26% | -4.22% | -3.71% |
| Medium-Term Momentum | +0.12% z+0.4 | -0.13% | -0.42% | -0.04% | +1.31% |
| Style-Positioning | |||||
| Hedge-Fund Ownership | +0.04% z+0.4 | -0.12% | -0.01% | -0.16% | -0.23% |
| Short Interest | -0.03% z-0.2 | +0.35% | -0.66% | -0.59% | +1.21% |
| Style-Flow | |||||
| Morning Activity | +0.17% z+1.3 | +0.00% | +0.51% | +0.54% | +0.01% |
| Short-Sale Activity | -0.12% z-1.1 | +0.28% | +0.04% | +0.05% | -0.30% |
| Thematic | |||||
| Gold | +0.38% z+1.2 | +0.24% | -0.39% | +0.46% | -3.65% |
| Semiconductors | -0.55% z-0.9 | +0.51% | +1.10% | -3.46% | -5.18% |
| Oil | +0.22% z+0.5 | -0.26% | +1.39% | +0.07% | -1.37% |
| Treasury (Duration) | +0.11% z+0.3 | -0.23% | -0.62% | +1.10% | +0.49% |
| Bitcoin / Crypto | -0.01% z-0.0 | -0.05% | -0.05% | -0.99% | -0.93% |
| China | +0.01% z+0.0 | +0.11% | -0.19% | +1.18% | -3.05% |
5/20/60d windows include today's session; 1d is the previous session.
Pairwise realized correlation. Index variance net of the weighted idiosyncratic diagonal, over the cross terms — the estimator used for implied-correlation indices. 20-day window unless noted; history since 2020.
Factor z-score. Today's factor return divided by its daily-return standard deviation over ~1,600 trading days.
High-beta momentum cohort. US names above $2B market cap in the top quintile of both raw beta and 12-month momentum; membership frozen at each month's first business day. “Top 50” = the 50 strongest by combined rank.
Dispersion (realized). Total cross-sectional volatility net of the market component; high dispersion is the flip side of low correlation.
Stock-specific (idiosyncratic) return. The part of a stock's move not explained by market, style, or thematic factors in our decomposition.
VIXEQ / DSPX / COR1M. Cboe implied indices: single-stock volatility, dispersion, and 1-month implied correlation (top-50 S&P names). Quotes delayed ~15 minutes.
Data compiled by FactorPulse AI; edited and verified by Jeff Klein. For informational purposes only. Does not constitute financial advice, an investment recommendation, or an offer to buy or sell any securities. Always consult a qualified financial professional before making investment decisions.
For more on factor construction methodology, see www.factorpulse.com/glossary.