Prime-brokerage data published Tuesday says the July de-grossing is finished. Morgan Stanley recorded the fastest three-day reduction in gross exposure since 2021, with US equity long/short gross leverage down to 208% (93rd percentile) and net leverage back up to 52%; Goldman Sachs Prime Brokerage puts total book gross leverage at a five-year high of 313.7% while net leverage sits at 71.3%, the bottom decile of the past year. The same data set has systematic CTAs, after an estimated $190bn of equity selling over the past 30 days, turning to long signals on the S&P 500 and the Nasdaq 100 as of August 4. That was the trade that broke last month, when hedge funds offloaded global technology stocks at the fastest three-day pace since 2016 and Citadel absorbed Situational Awareness's public bookWSJ.
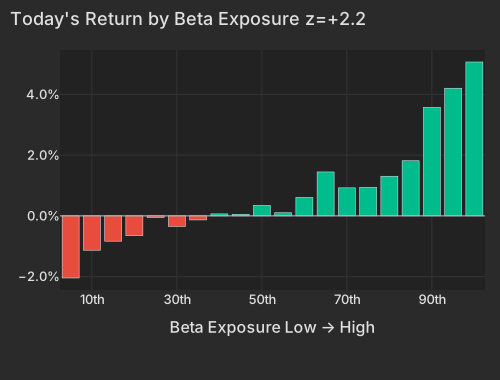
Our cross-section agrees on direction and is specific about the channel. Beta is +2.17% today (z=+2.22) and +5.42% over five sessions (five-day z=+2.51), while its 20-day and 63-day z-scores are flat at -0.18 and +0.17 — this is a five-day event, not a quarter-long trend. It is also unusually load-bearing: Beta alone explains 31% of today's cross-sectional variance, its top decile versus the past year, and its return per unit of exposure ranks in the 97.8th percentile since 2020. The bid reached the names that were being sold short into it — Short-Sale Activity at z=+1.38 means yesterday's most heavily short-sold names outperformed the barely-shorted ones, a squeeze-like outcome against the single most reliable effect in the model.
| Bucket | Avg Ret Pct |
|---|---|
| 1 | -2.05 |
| 2 | -1.13 |
| 3 | -0.83 |
| 4 | -0.65 |
| 5 | -0.05 |
| 6 | -0.35 |
| 7 | -0.13 |
| 8 | 0.06 |
| 9 | 0.05 |
| 10 | 0.34 |
| 11 | 0.10 |
| 12 | 0.61 |
| 13 | 1.45 |
| 14 | 0.92 |
| 15 | 0.94 |
| 16 | 1.31 |
| 17 | 1.82 |
| 18 | 3.58 |
| 19 | 4.20 |
| 20 | 5.07 |
| Factor | Return | Z-Score | 5d Z | 20d Z | 63d Z | Category | Direction |
|---|---|---|---|---|---|---|---|
| Beta | +2.17% | +2.22 | +2.51 | -0.18 | +0.17 | Style-Risk | High-beta names led |
| Value | -0.44% | -1.83 | -0.58 | +1.09 | -0.29 | Style | Growth-priced beat cheapest |
| Gold | +0.46% | +1.42 | -0.72 | -0.04 | -1.27 | Thematic | Gold-linked names led |
| Short-Sale Activity | +0.15% | +1.38 | +0.04 | -0.07 | +0.27 | Style-Flow | Most short-sold names outperformed |
| Short-Term Momentum | -0.33% | -1.01 | -3.13 | -3.92 | -2.89 | Style-Momentum | Recent multi-day winners lagged |
| Medium-Term Momentum | -0.24% | -0.81 | -0.4 | -0.8 | +0.9 | Style-Momentum | Medium-term winners lagged |
| Long-Term Momentum | -0.06% | -0.09 | +0.1 | -1.0 | -0.5 | Style-Momentum | Twelve-month winners flat |
| Oil | -0.22% | -0.46 | +1.6 | +0.6 | -0.7 | Thematic | Oil-levered names lagged mildly |
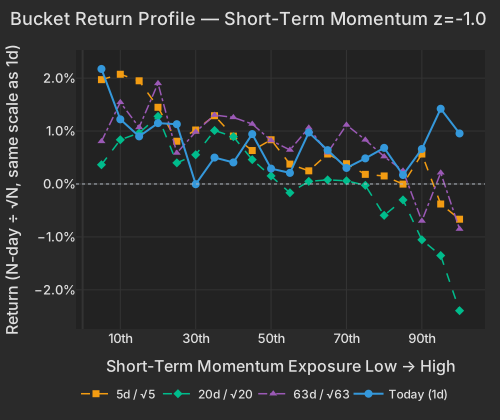
This is where the desk narrative and the factor structure part company. If July's leadership were being re-bought, the momentum block would lead; it does not. Long-Term Momentum is flat, Medium-Term Momentum is -0.24%, and Short-Term Momentum continues a reversal that has now run -5.71% over 20 days and -6.90% over 60 — today's z=-1.01 carries the same sign as its 20-day z=-3.92 and 63-day z=-2.89. Split the high-beta momentum screen and the point is unmistakable: names clearing only the high-beta test are +3.03%, names clearing only the twelve-month momentum test +0.28%. The crowded group that clears both is +3.23% against -0.25% for everything that clears neither. Market sensitivity is being bought back; the winners list is not.
| Bucket | Ret 1D Pct | Ret 5D Norm Pct | Ret 20D Norm Pct | Ret 63D Norm Pct |
|---|---|---|---|---|
| 1 | 2.17 | 1.97 | 0.36 | 0.80 |
| 2 | 1.22 | 2.07 | 0.84 | 1.54 |
| 3 | 0.90 | 1.95 | 0.96 | 1.07 |
| 4 | 1.15 | 1.45 | 1.28 | 1.90 |
| 5 | 1.13 | 0.81 | 0.40 | 0.59 |
| 6 | -0.00 | 1.02 | 0.55 | 0.99 |
| 7 | 0.50 | 1.29 | 1.01 | 1.30 |
| 8 | 0.41 | 0.90 | 0.89 | 1.26 |
| 9 | 0.94 | 0.63 | 0.46 | 1.13 |
| 10 | 0.29 | 0.84 | 0.15 | 0.82 |
| 11 | 0.21 | 0.38 | -0.17 | 0.64 |
| 12 | 0.97 | 0.25 | 0.05 | 1.06 |
| 13 | 0.64 | 0.57 | 0.08 | 0.59 |
| 14 | 0.30 | 0.38 | 0.06 | 1.12 |
| 15 | 0.48 | 0.18 | -0.03 | 0.83 |
| 16 | 0.68 | 0.15 | -0.59 | 0.52 |
| 17 | 0.17 | -0.00 | -0.30 | 0.25 |
| 18 | 0.66 | 0.57 | -1.05 | -0.70 |
| 19 | 1.42 | -0.38 | -1.35 | 0.21 |
| 20 | 0.95 | -0.67 | -2.39 | -0.85 |
The names give it texture. Wolfspeed +7.34%, Navitas +7.66%, Ouster +8.43% and Intuitive Machines +6.80% are up with almost nothing company-specific in them — pure carry from the beta complex. AMD is +5.13% ahead of its report after today's closeBloomberg, and the memory-chip complex is the sharpest expression of it: DRAM +5.81% and Korea's EWY +5.12% against 20-day drawdowns of -21.05% and -15.60%, with Chinese AI and semiconductor indices rebounding overnightEconomic Times. What is being repaired is the drawdown, not the trend.
| ETF | Theme | Today | 1d Ago | 5d Ago | 20d Ago | 63d Ago |
|---|---|---|---|---|---|---|
| DRAM | memory chips & storage | +5.81% | +1.51% | -2.48% | -21.05% | +26.53% |
| EWY | south korea | +5.12% | +2.00% | -0.60% | -15.60% | -1.09% |
| SMH | semiconductors | +4.33% | +0.91% | -0.56% | -9.74% | +6.99% |
| GDX | gold miners | +2.90% | +2.63% | +0.42% | -3.42% | -12.70% |
| MTUM | momentum | +2.50% | +0.73% | -0.18% | -6.19% | +5.85% |
| SPY | large cap | +0.62% | +1.42% | +2.51% | +0.85% | +5.14% |
| XLRE | real estate | -1.26% | +0.24% | -1.27% | +2.01% | +1.94% |
| XLU | utilities | -1.45% | +0.02% | -2.89% | -2.08% | -4.70% |
| XLE | energy | -2.43% | -1.28% | +0.74% | +10.65% | -0.10% |
| USO | oil | -4.73% | -5.46% | -2.12% | +17.03% | -14.48% |
Two things argue this is one leg in, not the finished job. In yesterday's session the same high-beta group traded below the broader market's volume pace, its internal dispersion was normal rather than basket-like, and the easiest-to-sell names were not out in front — the gains spread across the group in their usual proportion instead of concentrating in the names that fit the profile most closely. Breadth is also thin: SPY is +0.62%, IWM +0.39%, XLF -0.21%, and the index leg accounts for only 3.5% of today's cross-sectional variance against 59.3% idiosyncratic. Underneath, dispersion has been historically wide for weeks — implied single-stock correlation (Cboe COR1M) sits at 5.64, the lowest 0.5% of its roughly 20-year history, where it has been pinned rather than newly arriving.
The two largest gains belong to their own companies, not the factor complex. Palantir is +20.17%, and +17.1% of that is the stock's own move — the largest idiosyncratic print in its trailing year — on second-quarter revenue of $1.94bn, up 93%, US commercial revenue up 149%, and raised full-year guidance, as CNBC reported Tuesday. Caterpillar is +10.64% on adjusted EPS of $8.17 against a $6.20 consensus, record quarterly revenue of $20.54bn and an order backlog of $72.1bn, up 92%, with data-centre power generation named as the driver. Same AI capex, two very different income statements — and in both cases the style contribution is a rounding error next to the company-specific move. Cummins is the other side of that ledger at -6.82%, a record $9.5bn quarter with an EPS miss.
Qatar said Tuesday a draft short-term US–Iran agreement is circulating, aimed at reopening the Strait of Hormuz, and Brent fell below $82Bloomberg. USO is -4.73% and XLE -2.43%, giving back part of a 20-day run of +10.65%, with Goldman Sachs now framing Brent as range-bound at $80–$90 until the conflict's path is clear and Aramco's second-quarter profit up sharply on the war's price effectNYT. But the Oil factor itself is barely moving at z=-0.46. XOM's -3.50% and CVX's -3.31% are almost entirely style-carried through their negative beta exposures — a supermajor with a beta tilt of -1.6 is the wrong instrument to own on a day the beta bucket rips, whatever crude does. Meanwhile the precious-metals side is priced off the opposite headline: bullion futures at $4,713 after Trump's "last chance" warning to TehranBloomberg, GDX +2.90%, SLV +3.02%, and the Gold factor at z=+1.42 against a 63-day z=-1.27. The dollar is unchanged at 99.89CNBC, so that bid is the headline, not the currency.
| Sector | Median Ret Pct |
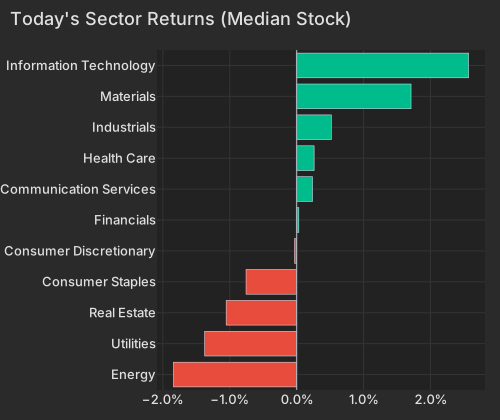
|---|---|
| Energy | -1.84 |
| Utilities | -1.38 |
| Real Estate | -1.05 |
| Consumer Staples | -0.76 |
| Consumer Discretionary | -0.03 |
| Financials | 0.03 |
| Communication Services | 0.24 |
| Health Care | 0.26 |
| Industrials | 0.52 |
| Materials | 1.71 |
| Information Technology | 2.57 |
Rates are lower across the curve — the 2-year at 4.194%, down 6.2 bp, the 10-year at 4.635%, down 4.9 bp, the 30-year at 5.199%CNBC — and the duration-sensitive equity proxies are being sold anyway: XLU -1.45%, XLRE -1.26%, IYR -1.28%. Defensives losing ground on a bull-steepening morning is the clearest confirmation that the money moving today is moving into risk, not out of it.
The June JOLTS bls.gov report is due at 10:00 AM ET; consensus looks for roughly 7.42 million openings against 7.594 million in May, with TD Securities projecting a steeper drop to 7.0 million — a soft print lands into a front end that has already rallied 6 bp. The June trade deficit, released this morning, narrowed 5.6% to $73.3bn as imports fell $7.3bn, with a $5.7bn decline in crude oil exports inside the mixBEA. AMD and SpaceX report after the close, the latter for the first time as a public company.
Variance decomposition: live intraday — 20260804 session, bracketed against its trailing-year range. Factor returns are trailing through last close. Total cross-sectional dispersion: 69%ile of the past year.
Variance mix — % of total, today vs 1d ago vs 1-yr avg
market 48%ile style 91.2%ile thematic 26%ile idiosyncratic 23%ile
Variance explained — today vs. factor's trailing-year range
Marker = the factor's share of today's total variance, placed in its own trailing-year range (box 25–75%ile, ticks 90%ile and max). Amber marker = unusually load-bearing today (≥90%ile of its own year). Factor name green = up today / red = down.
Correlation & dispersion — realized vs implied
Pairwise realized correlation (20d): 6.70% 1.1%ile since 2020 · 25%ile 3m
Top-500 pairwise: 9.12% 5.1%ile since 2020 · 29%ile 3m · implied (Cboe COR1M): 5.64 0.5%ile of its own history (gap +3.5pp)
Realized 20d vol (ann. pts): all stocks 48 vs VIXEQ 45 · index 11 vs VIX 16 · style factors 30 97.4%ile
20-day window (19 completed days + today); percentiles vs model history since 2020; '3m' tokens rank vs the trailing 63 trading days; definitions in Terms below. Implied prints (Cboe) are delayed ~15 min. as of 09:41 ET
High-beta momentum cohort (eq-wt, since-2020 rank): +3.2% 91.9%ile · rest of market -0.2%
| Factor | Today | 1d | 5d | 20d | 60d |
|---|---|---|---|---|---|
| Style-Risk | |||||
| Beta | +2.11% z+2.2 | +1.59% | +5.42% | -0.83% | -1.57% |
| Residual Volatility | +0.38% z+0.8 | +0.56% | +2.15% | +0.31% | -0.73% |
| International | +0.01% z+0.0 | -0.60% | -0.10% | +0.50% | -1.32% |
| Style | |||||
| Value | -0.42% z-1.8 | +0.24% | -0.29% | +1.17% | -0.85% |
| Leverage | -0.17% z-0.9 | -0.12% | -0.95% | -1.10% | -1.61% |
| Growth | +0.20% z+0.8 | +0.15% | +0.25% | +0.70% | +2.58% |
| Liquidity | +0.20% z+0.7 | +0.26% | +1.09% | +0.61% | -1.28% |
| Profitability | +0.09% z+0.5 | -0.29% | -0.31% | +0.70% | -0.69% |
| Size | -0.14% z-0.4 | -0.21% | +0.50% | -0.28% | -0.60% |
| Dividend Yield | -0.01% z-0.0 | -0.02% | -0.18% | -0.18% | -0.49% |
| Style-Momentum | |||||
| Short-Term Momentum | -0.32% z-1.0 | +0.15% | -2.28% | -5.71% | -6.90% |
| Medium-Term Momentum | -0.24% z-0.8 | -0.19% | -0.20% | -1.04% | +1.72% |
| One-Day Momentum | -0.21% z-0.7 | +0.54% | +0.52% | +0.81% | +4.61% |
| Long-Term Momentum | -0.06% z-0.1 | -1.05% | +0.11% | -2.94% | -2.18% |
| Style-Positioning | |||||
| Hedge-Fund Ownership | +0.02% z+0.2 | +0.13% | +0.21% | +0.00% | -0.67% |
| Short Interest | +0.02% z+0.1 | -0.05% | -0.64% | -1.01% | +0.98% |
| Style-Flow | |||||
| Short-Sale Activity | +0.15% z+1.3 | +0.05% | +0.00% | -0.04% | -0.19% |
| Morning Activity | +0.08% z+0.6 | +0.19% | +0.71% | +0.39% | -0.27% |
| Thematic | |||||
| Gold | +0.45% z+1.4 | -0.24% | -0.53% | -0.07% | -3.70% |
| Treasury (Duration) | -0.28% z-0.8 | -0.17% | -0.63% | +0.69% | +0.11% |
| Oil | -0.22% z-0.5 | -0.24% | +1.75% | +1.22% | -1.09% |
| Semiconductors | +0.18% z+0.3 | -1.06% | +0.40% | -1.91% | -4.00% |
| China | +0.09% z+0.2 | -0.18% | +0.18% | +1.46% | -3.19% |
| Bitcoin / Crypto | +0.05% z+0.1 | -0.33% | +0.30% | -0.69% | -0.71% |
5/20/60d windows include today's session; 1d is the previous session.
Factor z-score. Today's factor return divided by its daily-return standard deviation over ~1,600 trading days.
High-beta momentum cohort. US names above $2B market cap in the top quintile of both raw beta and 12-month momentum; membership frozen at each month's first business day. “Top 50” = the 50 strongest by combined rank.
Dispersion (realized). Total cross-sectional volatility net of the market component; high dispersion is the flip side of low correlation.
Stock-specific (idiosyncratic) return. The part of a stock's move not explained by market, style, or thematic factors in our decomposition.
VIXEQ / DSPX / COR1M. Cboe implied indices: single-stock volatility, dispersion, and 1-month implied correlation (top-50 S&P names). Quotes delayed ~15 minutes.
Data compiled by FactorPulse AI; edited and verified by Jeff Klein. For informational purposes only. Does not constitute financial advice, an investment recommendation, or an offer to buy or sell any securities. Always consult a qualified financial professional before making investment decisions.
For more on factor construction methodology, see www.factorpulse.com/glossary.