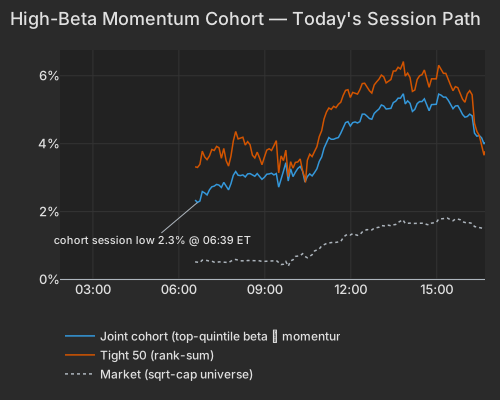
The claim, reported August 4 and covering flows through Monday’s session at the latest: Goldman Sachs Prime Brokerage recorded fundamental long/short net leverage at 69.2%, a z-score of +1.1 against the trailing year, with gross up 180bps to 248% and Information Technology bought at the fastest clip since May. The bundle carries a second Goldman reading for the week ending August 1 that puts the book at 208.1% gross and 52.8% net; take the direction from these numbers, not the level. Our side of the ledger is independent and runs through today’s session: Beta +1.87% (z=+1.9) with 6.7% conditional importance, Residual Volatility +0.64% (z=+1.3), and a cross-section in which the high-beta momentum names — the group that acted as the proxy for the late-July deleveraging — put up +4.01%, a 96th-percentile session since 2020, while everything outside the screen managed +1.02%.
| Factor | Return | Z-Score | 5d Z | 20d Z | 63d Z | Category | Direction |
|---|---|---|---|---|---|---|---|
| Beta | +1.87% | +1.9 | +2.4 | -0.2 | +0.1 | Style-Risk | High-beta names led |
| Short-Sale Activity | +0.23% | +2.0 | +0.3 | +0.1 | +0.4 | Style-Flow | Yesterday's short sales lost T+1 |
| Short Interest | +0.33% | +1.9 | -0.9 | -0.9 | +1.1 | Style-Positioning | Most-shorted outperformed |
| International | -0.52% | -1.7 | -0.9 | -0.0 | -0.8 | Style-Risk | US names over US-listed foreign |
| Residual Volatility | +0.64% | +1.3 | +2.2 | +0.3 | -0.2 | Style-Risk | Higher-volatility names led |
| Short-Term Momentum | -0.41% | -1.3 | -3.3 | -4.0 | -2.9 | Style-Momentum | Recent multi-day winners gave back |
| Hedge-Fund Ownership | -0.10% | -0.9 | +0.4 | -0.2 | -1.1 | Style-Positioning | No ownership-specific bid |
| Series | Ret Pct |
|---|---|
| joint | 4.01 |
| tight50 | 3.72 |
| market | 1.52 |
| rest | 1.02 |
Short-Term Momentum ran -0.41% (z=-1.3) and Long-Term Momentum -0.11%, so the sorting variable today was market sensitivity, not a twelve-month track record. That distinction has names attached. Wolfspeed rose +9.65% with essentially none of it stock-specific, Penguin Solutions +9.31% with the stock's own move slightly negative, and Marvell +11.51% of which roughly seven points was factor carry. MTUM's +3.06% is the same phenomenon wearing a momentum label — the ETF holds what beta lifted. Semiconductors as a theme contributed almost nothing on a residualized basis (z=+0.5), which is the useful thing to know about a day when SMH closed the regular session +5.50%.
| ETF | Theme | Today | 1d Ago | 5d Ago | 20d Ago | 63d Ago |
|---|---|---|---|---|---|---|
| DRAM | memory chips & storage | +6.41% | +1.51% | -2.48% | -21.05% | +26.53% |
| EWY | south korea | +6.18% | +2.00% | -0.60% | -15.60% | -1.09% |
| XLK | technology | +4.72% | +1.53% | +2.15% | -3.01% | +9.99% |
| IGV | software | +4.60% | +3.00% | +7.16% | +2.77% | +12.46% |
| SMH | semiconductors | +4.51% | +0.91% | -0.56% | -9.74% | +6.99% |
| ARKK | innovation growth | +3.48% | +3.23% | +1.39% | -12.04% | -4.39% |
| MTUM | momentum | +3.06% | +0.73% | -0.18% | -6.19% | +5.85% |
| SPY | large cap | +1.91% | +1.42% | +2.51% | +0.85% | +5.14% |
| XLE | energy | -0.33% | -1.28% | +0.74% | +10.65% | -0.10% |
| USO | oil | -5.89% | -5.46% | -2.12% | +17.03% | -14.48% |
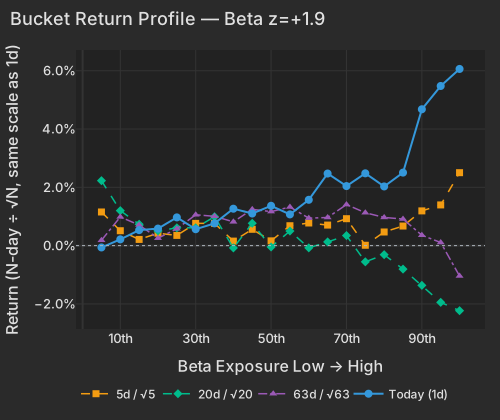
| Bucket | Ret 1D Pct | Ret 5D Norm Pct | Ret 20D Norm Pct | Ret 63D Norm Pct |
|---|---|---|---|---|
| 1 | -0.06 | 1.15 | 2.23 | 0.18 |
| 2 | 0.22 | 0.51 | 1.20 | 0.98 |
| 3 | 0.53 | 0.21 | 0.73 | 0.71 |
| 4 | 0.58 | 0.43 | 0.50 | 0.26 |
| 5 | 0.97 | 0.35 | 0.61 | 0.58 |
| 6 | 0.56 | 0.76 | 0.61 | 1.06 |
| 7 | 0.76 | 0.76 | 0.99 | 1.01 |
| 8 | 1.27 | 0.15 | -0.08 | 0.82 |
| 9 | 1.10 | 0.56 | 0.77 | 1.24 |
| 10 | 1.37 | 0.16 | -0.05 | 1.17 |
| 11 | 1.07 | 0.68 | 0.50 | 1.33 |
| 12 | 1.57 | 0.78 | -0.08 | 0.94 |
| 13 | 2.47 | 0.71 | 0.13 | 0.97 |
| 14 | 2.04 | 0.92 | 0.35 | 1.41 |
| 15 | 2.48 | 0.01 | -0.56 | 1.13 |
| 16 | 2.03 | 0.47 | -0.31 | 0.97 |
| 17 | 2.51 | 0.67 | -0.81 | 0.91 |
| 18 | 4.68 | 1.19 | -1.36 | 0.36 |
| 19 | 5.48 | 1.40 | -1.95 | 0.11 |
| 20 | 6.06 | 2.50 | -2.23 | -1.04 |
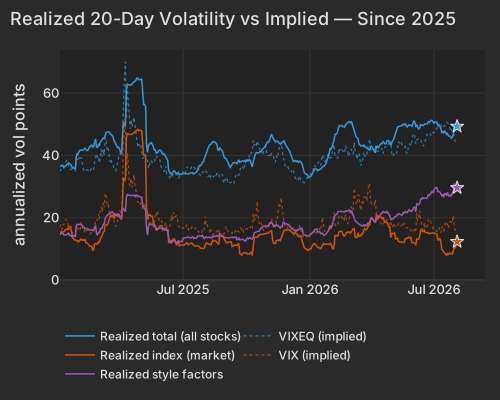
That 20-day slope is the reason this matters more than a one-day bounce. Beta's variance share over the blended five-day window sits at 31.0 vol points, the 99.3rd percentile since 2020, and 22.8 points over twenty days at the 98.1st — the cross-section has been organizing itself along the market-sensitivity axis for weeks, first punishing the high-exposure names and now paying them. Realized style volatility of 29.6 vol points ranks 97.4th percentile since 2020 while index volatility runs 12.3 points at the 25.8th, and implied single-stock volatility (Cboe VIXEQ) at 45.73 towers over VIX at 16.5. Underneath a calm index, factor risk is doing nearly all the work.
| Series | Today Vol Pts | Prev Close Vol Pts |
|---|---|---|
| total | 49.30 | 48.96 |
| market | 12.30 | 11.12 |
| style | 29.60 | 30.20 |
Short Interest at z=+1.9 and Short-Sale Activity at z=+2.0 both ran positive, which happens rarely: these are the model's largest annualized drag and its most statistically reliable effect respectively, and both pay the other way on a normal day. The most heavily shorted names averaged +2.9% in the top bucket, and yesterday's most heavily short-sold names beat the barely-shorted ones T+1. This is not the same trade as the beta bid — the high-beta momentum names screen modestly less shorted than the universe (-0.53σ on short interest, -0.50σ on prior-session short-sale flow), and short interest correlates -0.15 with the group's membership. Two separate pressures on the same day. The context is a market where S&P 500 short interest has reached a record 3.7% of index free float, the highest since 2010 by Citi's read, and where SpaceX carries a $24.6bn short position into an August 6 lockup expiry ahead of its first public results tonightBloomberg.
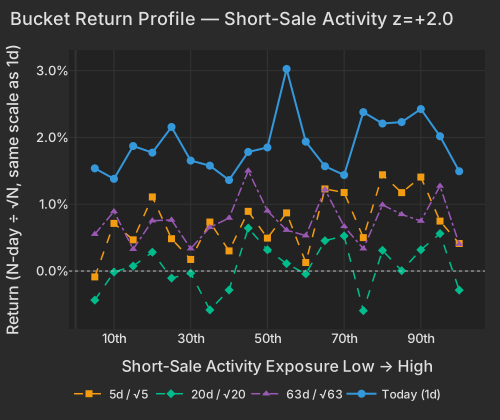
| Bucket | Ret 1D Pct | Ret 5D Norm Pct | Ret 20D Norm Pct | Ret 63D Norm Pct |
|---|---|---|---|---|
| 1 | 1.54 | -0.09 | -0.44 | 0.55 |
| 2 | 1.38 | 0.71 | -0.02 | 0.89 |
| 3 | 1.87 | 0.47 | 0.07 | 0.33 |
| 4 | 1.77 | 1.11 | 0.28 | 0.75 |
| 5 | 2.16 | 0.48 | -0.11 | 0.77 |
| 6 | 1.65 | 0.17 | -0.03 | 0.34 |
| 7 | 1.58 | 0.73 | -0.58 | 0.65 |
| 8 | 1.36 | 0.30 | -0.28 | 0.79 |
| 9 | 1.78 | 0.89 | 0.64 | 1.50 |
| 10 | 1.85 | 0.49 | 0.32 | 0.90 |
| 11 | 3.03 | 0.87 | 0.11 | 0.61 |
| 12 | 1.94 | 0.13 | -0.04 | 0.53 |
| 13 | 1.57 | 1.23 | 0.45 | 1.22 |
| 14 | 1.44 | 1.18 | 0.53 | 0.67 |
| 15 | 2.38 | 0.50 | -0.59 | 0.33 |
| 16 | 2.21 | 1.44 | 0.31 | 0.99 |
| 17 | 2.23 | 1.17 | 0.01 | 0.85 |
| 18 | 2.42 | 1.41 | 0.32 | 0.75 |
| 19 | 2.02 | 0.75 | 0.56 | 1.27 |
| 20 | 1.49 | 0.41 | -0.29 | 0.40 |
Our ownership lens does not corroborate an ownership-specific bid. Hedge-Fund Ownership finished slightly negative on a residualized basis (z=-0.9) and +0.11% on a raw basis: the names hedge funds own rose about as much as their beta and momentum tilts already explain, and nothing beyond. In yesterday's session the high-beta momentum names traded on light volume, roughly 0.73 times the market's pace, with the easiest-to-sell names leading (+3.96% in the top liquidity third against +2.23% in the bottom); today's move spread across the group in its usual proportion rather than concentrating in the most profile-fitting names. Prices are moving faster than shares are changing hands, which bounds how strong a releveraging story the equity data alone can support. Coatue's hedge fund, down 8.3% in July and still up 14.3% on the yearBloomberg, is a reminder of what the buying is digging out from. And the day's biggest AI print went the wrong way: AMD grew revenue 50% with data-center sales doubling and still fell more than 10% after the bellCNBC.
Idiosyncratic risk still accounted for 63.6% of cross-sectional variance, and the single-name list explains why. Palantir closed +29.49% and gave back -1.66% after the bell on 93% revenue growth and raised full-year guidanceBloomberg, adding $85.6bn of market value with 24.2 points of the move its own; Zebra Technologies +26.34% and Gartner +23.24% on beats and raisesBloomberg; Wayfair +29.67% on its strongest US growth since 2020Bloomberg. On the other side, Bruker fell -21.39% on a revenue miss and cut sales guidanceBloomberg. Resideo's -27.88% session print is not a repricing of the business: the NYSE said ADI Global Distribution began trading today after its spin-off from Resideo, and the print should be read as structure, not news.
Energy remains the quiet counterweight to all of it. Crude fell hard on Qatar's signal of a draft short-term US-Iran agreement to reopen the Strait of HormuzBloomberg, with Brent settling around $79, its lowest since July 10Bloomberg. USO fell -5.89% and BP -3.92%, yet the residualized Oil factor moved just -0.13% (z=-0.3) — the energy complex is repricing as a sector, not as a factor exposure the rest of the market has to hedge. Realized 20-day correlation of 7.97% remains pinned near its lows, the 3.0th percentile since 2020, though the five-day gauge at 15.06% now sits in the 79.4th percentile of the trailing three months. Single stocks are still trading on their own stories; the fast window says slightly less so than a week ago.
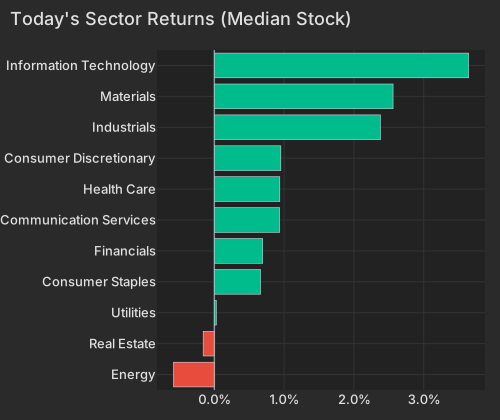
| Sector | Median Ret Pct |
|---|---|
| Energy | -0.59 |
| Real Estate | -0.16 |
| Utilities | 0.03 |
| Consumer Staples | 0.66 |
| Financials | 0.69 |
| Communication Services | 0.94 |
| Health Care | 0.94 |
| Consumer Discretionary | 0.95 |
| Industrials | 2.38 |
| Materials | 2.56 |
| Information Technology | 3.64 |
The JOLTS bls.gov report, released at 10:00 AM ET, showed June job openings at 7.359 million against a 7.45 million consensus and a revised 7.537 million prior, with the quits rate steady at 2.0% and hiring up to 5.35 millionBloomberg. Treasuries rallied across the curve on the miss: the 10-year fell 7.3bps to 4.611% and the 2-year 6.2bps to 4.194%, with the 30-year at 5.171%CNBC. TLT gained +0.95% against a 20-day return of -3.82%, and the dollar was unchanged at 99.88CNBC — a softer labor print delivered a duration bid without a currency move, which leaves the equity story where the factor data put it.
Variance decomposition: live intraday — 20260804 session, bracketed against its trailing-year range. Factor returns are trailing through last close. Total cross-sectional dispersion: 96.4%ile of the past year.
Variance mix — % of total, today vs 1d ago vs 1-yr avg
market 84%ile style 61%ile thematic 5.6%ile idiosyncratic 28%ile
Variance explained — today vs. factor's trailing-year range
Marker = the factor's share of today's total variance, placed in its own trailing-year range (box 25–75%ile, ticks 90%ile and max). Amber marker = unusually load-bearing today (≥90%ile of its own year). Factor name green = up today / red = down.
Correlation & dispersion — realized vs implied
Pairwise realized correlation (20d): 7.97% 3.0%ile since 2020 · 35%ile 3m
Top-500 pairwise: 10.46% 8.4%ile since 2020 · 52%ile 3m · implied (Cboe COR1M): 7.19 0.9%ile of its own history (gap +3.3pp)
Realized 20d vol (ann. pts): all stocks 49 vs VIXEQ 46 · index 12 vs VIX 16 · style factors 30 97.4%ile
20-day window (19 completed days + today); percentiles vs model history since 2020; '3m' tokens rank vs the trailing 63 trading days; definitions in Terms below. Implied prints (Cboe) are delayed ~15 min. as of 16:41 ET
High-beta momentum cohort (eq-wt, since-2020 rank): +4.0% 96.0%ile · rest of market +1.0%
| Factor | Today | 1d | 5d | 20d | 60d |
|---|---|---|---|---|---|
| Style-Risk | |||||
| Beta | +1.87% z+1.9 | +1.59% | +5.19% | -1.07% | -1.81% |
| International | -0.52% z-1.7 | -0.60% | -0.63% | -0.03% | -1.86% |
| Residual Volatility | +0.64% z+1.3 | +0.56% | +2.41% | +0.58% | -0.47% |
| Style | |||||
| Leverage | -0.24% z-1.4 | -0.12% | -1.02% | -1.18% | -1.69% |
| Profitability | +0.17% z+0.9 | -0.29% | -0.23% | +0.78% | -0.61% |
| Value | -0.21% z-0.9 | +0.24% | -0.08% | +1.39% | -0.64% |
| Liquidity | +0.22% z+0.8 | +0.26% | +1.11% | +0.64% | -1.26% |
| Growth | +0.16% z+0.6 | +0.15% | +0.21% | +0.66% | +2.53% |
| Dividend Yield | +0.08% z+0.5 | -0.02% | -0.09% | -0.09% | -0.40% |
| Size | -0.16% z-0.4 | -0.21% | +0.49% | -0.29% | -0.62% |
| Style-Momentum | |||||
| Short-Term Momentum | -0.41% z-1.3 | +0.15% | -2.37% | -5.80% | -6.99% |
| One-Day Momentum | -0.28% z-1.0 | +0.54% | +0.45% | +0.74% | +4.54% |
| Medium-Term Momentum | -0.10% z-0.3 | -0.19% | -0.06% | -0.90% | +1.85% |
| Long-Term Momentum | -0.11% z-0.2 | -1.05% | +0.05% | -3.00% | -2.23% |
| Style-Positioning | |||||
| Short Interest | +0.33% z+1.9 | -0.05% | -0.33% | -0.70% | +1.29% |
| Hedge-Fund Ownership | -0.10% z-0.9 | +0.13% | +0.10% | -0.11% | -0.78% |
| Style-Flow | |||||
| Short-Sale Activity | +0.23% z+2.0 | +0.05% | +0.08% | +0.04% | -0.11% |
| Morning Activity | +0.08% z+0.6 | +0.19% | +0.71% | +0.39% | -0.27% |
| Thematic | |||||
| Treasury (Duration) | -0.22% z-0.7 | -0.17% | -0.57% | +0.74% | +0.16% |
| Gold | +0.17% z+0.5 | -0.24% | -0.81% | -0.35% | -3.97% |
| Semiconductors | +0.32% z+0.5 | -1.06% | +0.54% | -1.77% | -3.87% |
| China | +0.12% z+0.3 | -0.18% | +0.22% | +1.49% | -3.16% |
| Oil | -0.13% z-0.3 | -0.24% | +1.84% | +1.32% | -1.00% |
| Bitcoin / Crypto | -0.06% z-0.2 | -0.33% | +0.19% | -0.80% | -0.81% |
5/20/60d windows include today's session; 1d is the previous session.
Market variance share. The fraction of cross-sectional variance explained by the market factor — the attribution companion to pairwise correlation, not a substitute for it.
Factor z-score. Today's factor return divided by its daily-return standard deviation over ~1,600 trading days.
High-beta momentum cohort. US names above $2B market cap in the top quintile of both raw beta and 12-month momentum; membership frozen at each month's first business day. “Top 50” = the 50 strongest by combined rank.
Stock-specific (idiosyncratic) return. The part of a stock's move not explained by market, style, or thematic factors in our decomposition.
VIXEQ / DSPX / COR1M. Cboe implied indices: single-stock volatility, dispersion, and 1-month implied correlation (top-50 S&P names). Quotes delayed ~15 minutes.
Data compiled by FactorPulse AI; edited and verified by Jeff Klein. For informational purposes only. Does not constitute financial advice, an investment recommendation, or an offer to buy or sell any securities. Always consult a qualified financial professional before making investment decisions.
For more on factor construction methodology, see www.factorpulse.com/glossary.