The positioning read arriving on desks this week is unambiguous. As noted by Goldman Sachs prime brokerage, global gross leverage sits at the 93rd percentile of its five-year range even after the fundamental long/short ratio compressed from 5.7x to 3.2x through July's selloff; BofA Securities, in the same week, calls Nasdaq-100 de-risking "largely complete," with systematic trend strength at 13% for the Nasdaq-100 against 53% for the S&P 500. Goldman also has the S&P 500 back above the 7,453 level that would have triggered an estimated $24.9 billion of systematic selling, which neutralizes the late-July threat rather than creating a new buy signal.
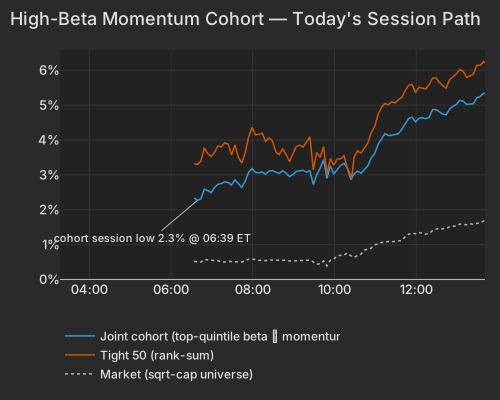
Our side of the ledger, same day: the high-beta momentum names are up +5.32% and the top 50 by rank are up +6.22% — the buying spread across the group in its usual proportion, not concentrated in the most profile-fitting names. It is the fifth extreme session for this group in eight, following July 28, 29, 30 and August 3, and it comes out of a drawdown that still stood at -18.9% at yesterday's close. Against that, the microstructure from yesterday's session says light participation: the group traded below the broader market's volume pace and its internal dispersion was normal rather than basket-shaped. Prices are being marked up faster than exposure is being bought, which places the episode mid-recovery — the de-risking has stopped, the re-grossing has not obviously started.
| Series | Ret Pct |
|---|---|
| joint | 5.32 |
| tight50 | 6.22 |
| market | 1.69 |
| rest | 1.00 |
| Factor | Return | Z-Score | 5d Z | 20d Z | 63d Z | Category | Direction |
|---|---|---|---|---|---|---|---|
| Beta | +2.53% | z=+2.6 | +2.7 | -0.1 | +0.2 | Style-Risk | Highest-beta names outperformed |
| Short-Sale Activity | +0.24% | z=+2.1 | +0.4 | +0.1 | +0.4 | Style-Flow | Yesterday's most short-sold names beat the barely-shorted |
| Short-Term Momentum | -0.51% | z=-1.6 | -3.4 | -4.1 | -3.0 | Style-Momentum | Last week's losers beat last week's winners |
| Residual Volatility | +0.63% | z=+1.3 | +2.1 | +0.3 | -0.2 | Style-Risk | More volatile names outperformed |
| Semiconductors | +0.68% | z=+1.1 | +0.7 | -0.5 | -0.6 | Thematic | Chip-exposed names outperformed |
| Short Interest | +0.19% | z=+1.1 | -1.3 | -1.1 | +1.0 | Style-Positioning | Most-shorted names outperformed |
| Leverage | -0.20% | z=-1.1 | -2.5 | -1.4 | -1.1 | Style | More levered names lagged |
| Hedge-Fund Ownership | -0.07% | z=-0.6 | +0.5 | -0.2 | -1.0 | Style-Positioning | Most hedge-fund-owned names lagged slightly |
Beta explains 23.5% of today's cross-sectional variance and its 5-day realized variance ranks in the 99.3rd percentile since 2020 — the market-sensitivity axis has rarely been this load-bearing. Five sessions of buying (+5.84%) have now more than erased a month of damage (-0.41% over 20 days). The names show what that means mechanically: SanDisk +11.90% and Marvell +14.53% with almost nothing company-specific in either move, Micron +8.48% where the entire gain is style, Penguin Solutions +10.77% with a slightly negative stock-specific leg. Information Technology's median stock is up +4.47%.
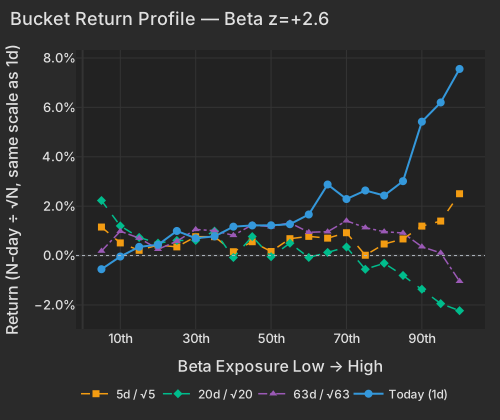
| Bucket | Ret 1D Pct | Ret 5D Norm Pct | Ret 20D Norm Pct | Ret 63D Norm Pct |
|---|---|---|---|---|
| 1 | -0.55 | 1.15 | 2.23 | 0.18 |
| 2 | -0.04 | 0.51 | 1.20 | 0.98 |
| 3 | 0.35 | 0.21 | 0.73 | 0.71 |
| 4 | 0.44 | 0.43 | 0.50 | 0.26 |
| 5 | 1.00 | 0.35 | 0.61 | 0.58 |
| 6 | 0.70 | 0.76 | 0.61 | 1.06 |
| 7 | 0.78 | 0.76 | 0.99 | 1.01 |
| 8 | 1.17 | 0.15 | -0.08 | 0.82 |
| 9 | 1.22 | 0.56 | 0.77 | 1.24 |
| 10 | 1.23 | 0.16 | -0.05 | 1.17 |
| 11 | 1.27 | 0.68 | 0.50 | 1.33 |
| 12 | 1.66 | 0.78 | -0.08 | 0.94 |
| 13 | 2.88 | 0.71 | 0.13 | 0.97 |
| 14 | 2.29 | 0.92 | 0.35 | 1.41 |
| 15 | 2.63 | 0.01 | -0.56 | 1.13 |
| 16 | 2.43 | 0.47 | -0.31 | 0.97 |
| 17 | 3.01 | 0.67 | -0.81 | 0.91 |
| 18 | 5.42 | 1.19 | -1.36 | 0.36 |
| 19 | 6.20 | 1.40 | -1.95 | 0.11 |
| 20 | 7.56 | 2.50 | -2.23 | -1.04 |
The ETF evidence tracks the same shape: the sharpest gains sit exactly where the 20-day damage was worst. Memory chips and storage lead everything, helped by a supply story with legs — Q3 contract DRAM prices are forecast 13–18% higher quarter-on-quarter as capacity shifts toward high-bandwidth memoryEconomic Times. Korea, the other end of that supply chain and the epicentre of July's Asian de-leveraging, is up +6.75% against a -15.60% 20-day run.
| ETF | Theme | Today | 1d Ago | 5d Ago | 20d Ago | 63d Ago |
|---|---|---|---|---|---|---|
| DRAM | memory chips & storage | +7.65% | +1.51% | -2.48% | -21.05% | +26.53% |
| EWY | south korea | +6.75% | +2.00% | -0.60% | -15.60% | -1.09% |
| SMH | semiconductors | +5.59% | +0.91% | -0.56% | -9.74% | +6.99% |
| MTUM | momentum | +4.21% | +0.73% | -0.18% | -6.19% | +5.85% |
| ARKK | innovation growth | +4.02% | +3.23% | +1.39% | -12.04% | -4.39% |
| QQQ | large cap growth | +3.27% | +1.76% | +2.63% | -3.15% | +3.84% |
| SPY | large cap | +1.87% | +1.42% | +2.51% | +0.85% | +5.14% |
| XLU | utilities | -0.64% | +0.02% | -2.89% | -2.08% | -4.70% |
| USO | oil | -5.23% | -5.46% | -2.12% | +17.03% | -14.48% |
Crude is the mirror image. Qatar and Washington signalled progress on a draft short-term framework to reopen the Strait of Hormuz, and Brent traded below $82Bloomberg. Oil futures are down -5.23% today with a 20-day gain of +17.03% still intact, and the Oil factor barely registered at -0.17% (z=-0.4) — the de-escalation is being priced in the commodity, not yet in the cross-section of energy equities. BP fell -3.67% on results.
The honest complication for a positioning story is that the largest moves on the board are company-specific. Palantir is up +29.74% after second-quarter revenue rose 93% with U.S. commercial revenue up 149%CNBC, and the stock's own move accounts for 26.2 points of that 29.7 — the biggest idiosyncratic print in its trailing year. Caterpillar +6.78% delivered adjusted EPS of $8.17 against $6.20 consensus with a record $72.1 billion backlog, up 92%, on data-centre build-outsBloomberg. Gartner is up +21.34% after beating on adjusted EPS of $4.37 and raising 2026 guidanceBloomberg, Wayfair +31.18% on its strongest U.S. growth since 2020Bloomberg, and Zebra Technologies +22.70% on its own results.
Misses are being punished with equal violence — NRG -15.18%, UL Solutions -15.63%, Aptiv -17.74% on its own results, Rockwell Automation -7.73% — which is not the signature of indiscriminate risk appetite. One caution on the screen: Resideo's -26.29% is mechanical, not a repricing, because ADI Global Distribution began NYSE trading today following the spin-off, as Morningstar's NYSE update noted. Even so, the variance split argues the factor complex, not the earnings calendar, is unusually in charge: stock-specific moves account for 51.5% of today's cross-sectional variance against a 66.7% one-year average, while the index leg at 19.4% and style at 28.0% both run well above theirs — and yesterday the index leg was effectively zero at 0.01%.
The structural signal in the bundle is not beta at all. Short-Term Momentum is at z=-1.6 today with a 20-day z of -4.1 and a 63-day z of -3.0, cumulatively -5.90% over 20 sessions and -7.09% over 60: the past week's winners have been handing money to the past week's losers for a month straight, and today extends that even as the index rises +1.87%. The worst recent-performance bucket is up +4.05% today. For a book that reloads on five-day strength, that is the persistent cost, and it has not turned.
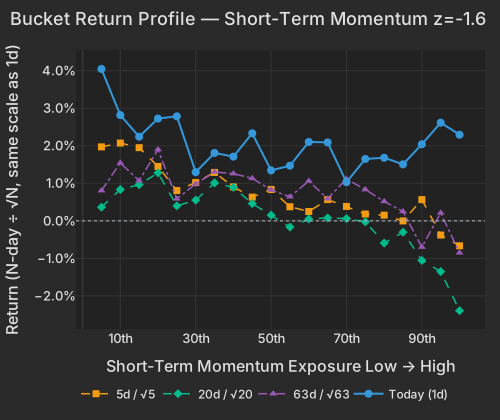
| Bucket | Ret 1D Pct | Ret 5D Norm Pct | Ret 20D Norm Pct | Ret 63D Norm Pct |
|---|---|---|---|---|
| 1 | 4.05 | 1.97 | 0.36 | 0.80 |
| 2 | 2.82 | 2.07 | 0.84 | 1.54 |
| 3 | 2.24 | 1.95 | 0.96 | 1.07 |
| 4 | 2.73 | 1.45 | 1.28 | 1.90 |
| 5 | 2.79 | 0.81 | 0.40 | 0.59 |
| 6 | 1.30 | 1.02 | 0.55 | 0.99 |
| 7 | 1.81 | 1.29 | 1.01 | 1.30 |
| 8 | 1.71 | 0.90 | 0.89 | 1.26 |
| 9 | 2.33 | 0.63 | 0.46 | 1.13 |
| 10 | 1.34 | 0.84 | 0.15 | 0.82 |
| 11 | 1.47 | 0.38 | -0.17 | 0.64 |
| 12 | 2.10 | 0.25 | 0.05 | 1.06 |
| 13 | 2.09 | 0.57 | 0.08 | 0.59 |
| 14 | 1.03 | 0.38 | 0.06 | 1.12 |
| 15 | 1.65 | 0.18 | -0.03 | 0.83 |
| 16 | 1.68 | 0.15 | -0.59 | 0.52 |
| 17 | 1.51 | -0.00 | -0.30 | 0.25 |
| 18 | 2.04 | 0.57 | -1.05 | -0.70 |
| 19 | 2.62 | -0.38 | -1.35 | 0.21 |
| 20 | 2.29 | -0.67 | -2.39 | -0.85 |
Two positioning lenses fired in the same direction and both cut against the durable baseline. Short Interest at z=+1.1 means the most heavily shorted names beat the un-shorted ones — a squeeze outcome, and a move contrary to one of the model's most reliable persistent effects, with Wayfair the obvious face of it. Short-Sale Activity at z=+2.1 ranks in the 98.8th percentile of its own daily direction history since 2020: yesterday's most heavily short-sold names outperformed the barely-shorted ones, so that flow lost money the following session. Hedge-Fund Ownership is the interesting null — flat-to-slightly-negative once beta and momentum are stripped out (-0.07%) but +0.12% on a raw basis, meaning the most hedge-fund-owned names participated through their style tilts and got nothing extra for being owned. Today pays the characteristic, not the ownership.
Which is why the volatility decomposition matters more than the index level. On the 20-day blend, realized style volatility is 30.1 vol points — the 97.7th percentile since 2020 — against 12.6 for the index leg at the 27.5th, with VIX at 16.5 and implied single-stock volatility (Cboe VIXEQ) at 45.98, the 96th percentile of its own history. Realized 20-day pairwise correlation of 8.34% sits at the 3.5th percentile since 2020 but only the 43rd percentile of the past three months; these lows are the quarter's norm now, not today's news. A calm index sitting on top of factor churn near stress-episode levels is the condition under which a positioning reversal can run for days without ever showing up in headline volatility — and it is the condition a PM carrying beta into tonight is actually exposed to.
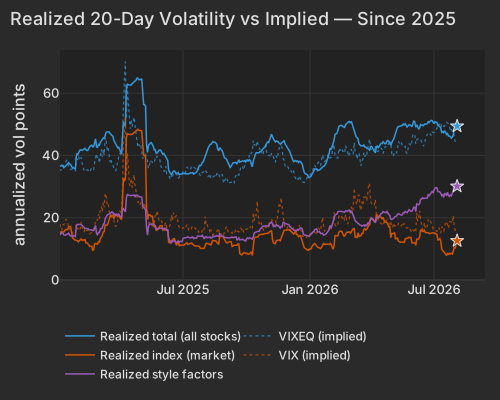
| Series | Today Vol Pts | Prev Close Vol Pts |
|---|---|---|
| total | 49.40 | 48.96 |
| market | 12.60 | 11.12 |
| style | 30.10 | 30.20 |
The JOLTS bls.gov report, released at 10:00 AM ET, showed June job openings falling to 7.359 million from a revised 7.537 million, under the 7.45 million consensus, with the quits rate steady at 2.0% and hiring up to 5.35 millionBloomberg. The curve took it as a September easing signal and the front end led: the 2-Year is at 4.196%, down 6.0 bps, the 10-Year at 4.627%, down 5.7 bps, while the 30-Year fell only 3.8 bps to 5.191%CNBC. Separately, the June trade deficit narrowed 5.6% to $73.3 billion as imports fell $7.3 billionBEA. The next test lands after the bell: AMD, up +9.24% on pre-earnings positioning alone, reports tonight alongside SpaceX's first public resultsBloomberg, and CNBC reported the options market is priced for a 12.3% post-earnings swing in AMD — a stock carrying a +2.49 beta exposure into the print.
Variance decomposition: live intraday — 20260804 session, bracketed against its trailing-year range. Factor returns are trailing through last close. Total cross-sectional dispersion: 97.2%ile of the past year.
Variance mix — % of total, today vs 1d ago vs 1-yr avg
market 86%ile style 82%ile thematic 19%ile idiosyncratic 15%ile
Variance explained — today vs. factor's trailing-year range
Marker = the factor's share of today's total variance, placed in its own trailing-year range (box 25–75%ile, ticks 90%ile and max). Amber marker = unusually load-bearing today (≥90%ile of its own year). Factor name green = up today / red = down.
Correlation & dispersion — realized vs implied
Pairwise realized correlation (20d): 8.34% 3.5%ile since 2020 · 43%ile 3m
Top-500 pairwise: 10.66% 8.6%ile since 2020 · 54%ile 3m · implied (Cboe COR1M): 7.01 0.9%ile of its own history (gap +3.6pp)
Realized 20d vol (ann. pts): all stocks 49 vs VIXEQ 46 · index 13 vs VIX 16 · style factors 30 97.7%ile
20-day window (19 completed days + today); percentiles vs model history since 2020; '3m' tokens rank vs the trailing 63 trading days; definitions in Terms below. Implied prints (Cboe) are delayed ~15 min. as of 13:41 ET
High-beta momentum cohort (eq-wt, since-2020 rank): +5.3% 98.5%ile · rest of market +1.0%
| Factor | Today | 1d | 5d | 20d | 60d |
|---|---|---|---|---|---|
| Style-Risk | |||||
| Beta | +2.53% z+2.6 | +1.59% | +5.84% | -0.41% | -1.15% |
| International | -0.46% z-1.5 | -0.60% | -0.57% | +0.03% | -1.80% |
| Residual Volatility | +0.63% z+1.2 | +0.56% | +2.40% | +0.56% | -0.48% |
| Style | |||||
| Liquidity | +0.37% z+1.3 | +0.26% | +1.26% | +0.78% | -1.11% |
| Dividend Yield | +0.22% z+1.2 | -0.02% | +0.05% | +0.04% | -0.26% |
| Leverage | -0.20% z-1.1 | -0.12% | -0.98% | -1.14% | -1.64% |
| Value | -0.19% z-0.8 | +0.24% | -0.06% | +1.41% | -0.62% |
| Profitability | +0.15% z+0.8 | -0.29% | -0.25% | +0.77% | -0.62% |
| Size | -0.20% z-0.5 | -0.21% | +0.45% | -0.33% | -0.65% |
| Growth | +0.09% z+0.4 | +0.15% | +0.14% | +0.59% | +2.47% |
| Style-Momentum | |||||
| Short-Term Momentum | -0.51% z-1.6 | +0.15% | -2.47% | -5.90% | -7.09% |
| One-Day Momentum | -0.24% z-0.8 | +0.54% | +0.49% | +0.77% | +4.58% |
| Medium-Term Momentum | -0.12% z-0.4 | -0.19% | -0.08% | -0.92% | +1.84% |
| Long-Term Momentum | +0.19% z+0.3 | -1.05% | +0.36% | -2.69% | -1.92% |
| Style-Positioning | |||||
| Short Interest | +0.19% z+1.1 | -0.05% | -0.48% | -0.85% | +1.14% |
| Hedge-Fund Ownership | -0.07% z-0.6 | +0.13% | +0.13% | -0.09% | -0.75% |
| Style-Flow | |||||
| Short-Sale Activity | +0.24% z+2.1 | +0.05% | +0.09% | +0.05% | -0.10% |
| Morning Activity | +0.02% z+0.1 | +0.19% | +0.65% | +0.32% | -0.34% |
| Thematic | |||||
| Semiconductors | +0.68% z+1.1 | -1.06% | +0.90% | -1.41% | -3.51% |
| Gold | +0.29% z+0.9 | -0.24% | -0.69% | -0.23% | -3.86% |
| Treasury (Duration) | -0.22% z-0.7 | -0.17% | -0.57% | +0.75% | +0.16% |
| Oil | -0.17% z-0.4 | -0.24% | +1.80% | +1.28% | -1.04% |
| Bitcoin / Crypto | -0.03% z-0.1 | -0.33% | +0.22% | -0.77% | -0.79% |
| China | +0.04% z+0.1 | -0.18% | +0.13% | +1.41% | -3.24% |
5/20/60d windows include today's session; 1d is the previous session.
Pairwise realized correlation. Index variance net of the weighted idiosyncratic diagonal, over the cross terms — the estimator used for implied-correlation indices. 20-day window unless noted; history since 2020.
Factor z-score. Today's factor return divided by its daily-return standard deviation over ~1,600 trading days.
High-beta momentum cohort. US names above $2B market cap in the top quintile of both raw beta and 12-month momentum; membership frozen at each month's first business day. “Top 50” = the 50 strongest by combined rank.
Dispersion (realized). Total cross-sectional volatility net of the market component; high dispersion is the flip side of low correlation.
Stock-specific (idiosyncratic) return. The part of a stock's move not explained by market, style, or thematic factors in our decomposition.
VIXEQ / DSPX / COR1M. Cboe implied indices: single-stock volatility, dispersion, and 1-month implied correlation (top-50 S&P names). Quotes delayed ~15 minutes.
Data compiled by FactorPulse AI; edited and verified by Jeff Klein. For informational purposes only. Does not constitute financial advice, an investment recommendation, or an offer to buy or sell any securities. Always consult a qualified financial professional before making investment decisions.
For more on factor construction methodology, see www.factorpulse.com/glossary.