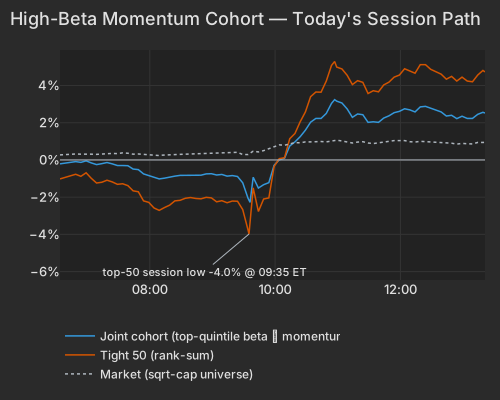
Today's buying went straight into the wreckage: the top 50 high-beta momentum names are up +4.78%, running 64th best of 1,653 sessions since 2020, while the rest of the market adds +0.79%. Beta is the load-bearing factor at +1.42% (z=+1.5) and 14.4% of cross-sectional variance. The momentum leg never arrived — high-beta names without the momentum tilt are +3.33%, high-momentum names without the beta tilt +0.02%.
The ISM's July manufacturing survey printed 55.6 against a 54.0 consensus at 10:00 ET, the fastest expansion in four years, with the employment sub-index at 52.8 — its first reading above 50 in 33 months. The group that had been left for dead went with it: from -3.98% at 09:35 the top 50 high-beta momentum names ran to +5.29% by 10:57 and have held there. The macro clearing came from two directions at once, because President Trump called off planned strikes on Iran over the weekend and Tehran's talks with Oman on reopening the Strait of Hormuz are in their final stagesBloombergNYT, taking Brent to just over $83 and the 10-year Treasury yield down 5.7 bps to 4.688%CNBC. Within the crowded high-beta momentum cohort the buying was not evenly spread — the top 50 moved 1.85× the broader ~190-name group against a 1.14× norm, so the more closely a name fit the high-beta momentum profile, the harder it ran.
| Factor | Return | Z-Score | 5d Z | 20d Z | 63d Z | Category | Direction |
|---|---|---|---|---|---|---|---|
| Beta | +1.42% | z=+1.5 | +0.4 | z=-1.4 | -0.1 | Style-Risk | High-beta names led |
| One-Day Momentum | +0.57% | z=+2.0 | z=+3.1 | +0.6 | z=+2.0 | Style-Momentum | Yesterday's gainers kept leading |
| Residual Volatility | +0.78% | z=+1.6 | z=+1.4 | +0.1 | -0.2 | Style-Risk | Most volatile names led |
| Long-Term Momentum | -1.04% | z=-1.6 | z=-1.2 | z=-1.1 | -0.4 | Style-Momentum | 1-year laggards beat winners |
| Semiconductors | -1.09% | z=-1.8 | z=-1.5 | z=-1.0 | -0.8 | Thematic | Chip-exposed names lagged |
| International | -0.60% | z=-2.0 | -0.3 | +0.3 | -0.7 | Style-Risk | US-headquartered names led |
| Hedge-Fund Ownership | +0.15% | z=+1.4 | +0.6 | +0.5 | -0.8 | Style-Positioning | Most-owned names led |
| Short Interest | +0.01% | z=+0.1 | -0.3 | -0.7 | z=+1.0 | Style-Positioning | Flat — no squeeze |
| Series | Ret Pct |
|---|---|
| joint | 2.59 |
| tight50 | 4.78 |
| market | 0.96 |
| rest | 0.79 |
Strip the two screens apart and the day resolves cleanly. High beta alone is +3.33%, the 94th percentile since 2020; high 12-month momentum alone is +0.02%, dead centre of its own history. The residualized momentum axis actually deteriorated further: Long-Term Momentum -1.04% (z=-1.6) on top of -3.09% over the past twenty sessions, with the worst 1-year laggards — NNE, SMR, OKLO, SMCI — up +5.6% as a bucket. Residual Volatility +0.78% (z=+1.6) and Liquidity are the same trade rather than separate confirmations; their exposures correlate 0.43 and 0.28 with the high-beta momentum group. Short Interest is flat at z=+0.1, which rules out short covering as the engine, and hedge-fund-owned names outperformed on both the residual (+0.15%) and raw (+0.32%, z=+2.2) reads.
The names carrying it are almost pure factor exposure: Wolfspeed +6.14%, D-Wave +10.62%, Redwire +11.58% and Velo3D +12.84% all show beta doing 8 points of the work with next to nothing stock-specific behind it. The ETF tape says the same thing about where the money went — into what had been destroyed, not into what has been working.
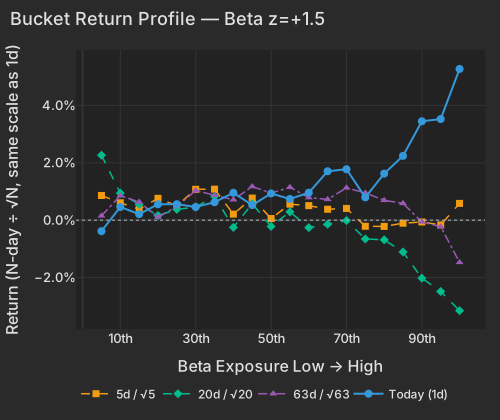
| Bucket | Ret 1D Pct | Ret 5D Norm Pct | Ret 20D Norm Pct | Ret 63D Norm Pct |
|---|---|---|---|---|
| 1 | -0.38 | 0.86 | 2.27 | 0.15 |
| 2 | 0.46 | 0.61 | 0.94 | 0.86 |
| 3 | 0.21 | 0.38 | 0.55 | 0.63 |
| 4 | 0.56 | 0.76 | 0.16 | 0.11 |
| 5 | 0.56 | 0.50 | 0.38 | 0.47 |
| 6 | 0.46 | 1.08 | 0.45 | 1.03 |
| 7 | 0.63 | 1.08 | 0.83 | 0.87 |
| 8 | 0.95 | 0.21 | -0.25 | 0.71 |
| 9 | 0.53 | 0.77 | 0.58 | 1.17 |
| 10 | 0.93 | 0.06 | -0.22 | 0.94 |
| 11 | 0.74 | 0.56 | 0.29 | 1.15 |
| 12 | 0.96 | 0.51 | -0.26 | 0.79 |
| 13 | 1.71 | 0.38 | -0.14 | 0.73 |
| 14 | 1.78 | 0.41 | -0.01 | 1.13 |
| 15 | 0.80 | -0.21 | -0.65 | 0.95 |
| 16 | 1.62 | -0.22 | -0.69 | 0.69 |
| 17 | 2.24 | -0.11 | -1.11 | 0.59 |
| 18 | 3.45 | -0.06 | -2.02 | -0.06 |
| 19 | 3.53 | -0.16 | -2.49 | -0.23 |
| 20 | 5.27 | 0.59 | -3.15 | -1.47 |
| ETF | Theme | Today | 1d Ago | 5d Ago | 20d Ago | 63d Ago |
|---|---|---|---|---|---|---|
| WGMI | crypto miners | +7.24% | -2.67% | -3.97% | -3.25% | +6.83% |
| URA | uranium | +4.27% | -1.64% | -2.06% | -9.62% | -30.75% |
| ARKK | innovation growth | +3.05% | -2.28% | -0.90% | -12.32% | -6.07% |
| AIPO | AI power infrastructure | +3.02% | +0.63% | -2.39% | -7.73% | -8.47% |
| EWY | south korea | +1.64% | -2.55% | -3.60% | -12.79% | -2.28% |
| SMH | semiconductors | +0.72% | +0.30% | -3.68% | -8.74% | +6.67% |
| MTUM | momentum | +0.40% | +0.27% | -2.22% | -5.35% | +5.50% |
| XLE | energy | -1.13% | +1.00% | -0.12% | +11.89% | -0.17% |
| USO | oil | -5.56% | +1.33% | -5.50% | +24.23% | -12.18% |
Set that against what the desks have been publishing. Goldman Sachs Prime reported the largest three-day net selling of global IT equities since 2016 last week, with Asian fundamental long-short funds down 18.6% month-to-date through July 28; Morgan Stanley's latest weekly read has US equity long-short gross leverage down 2 points to 208%, the 93rd percentile, with global momentum exposure back at the 53rd percentile. Morgan Stanley upgraded South Korean equities to overweight today, judging the technical leverage washout past its midpoint. On direction our data agrees for risk appetite — the high-beta group is up against a Beta factor still -6.00% over twenty sessions and a drawdown of 21.2% as of Friday's close. It does not yet agree for momentum: the 12-month-winner tilt earned nothing today, which is what a positioning repair looks like before it becomes an ownership decision.
The one complex that does not show up is the one that caused July. Semiconductors is -1.09% (z=-1.8), a per-sigma move in the 2.1st percentile since 2020, extending -2.77% over twenty sessions and -5.51% over sixty. SMH managed +0.72%; the memory and storage complex printed +1.35% against a 20-day -16.92%. Seoul set the tone: the Kospi fell more than 5% Monday with Samsung Electronics and SK Hynix each down 8%Economic Times, and Alphabet's +5.23% — a name whose chip exposure runs -2.1σ — was carried more by the factor complex than by anything of its own. Alibaba +4.48% after unveiling its most powerful AI model to dateBloomberg is the same rotation seen from the other side. Western Digital and SanDisk report Wednesday with options pricing implied moves of 16.8% and up to 25%, which is where this abstention gets resolved.
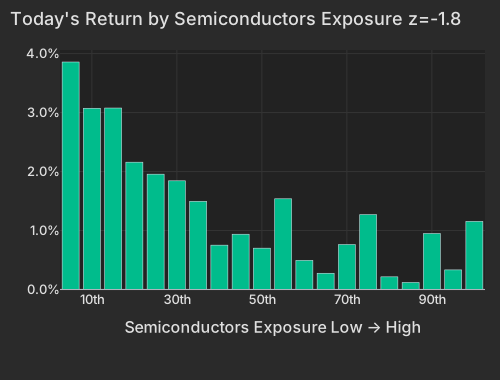
| Bucket | Avg Ret Pct |
|---|---|
| 1 | 3.86 |
| 2 | 3.07 |
| 3 | 3.08 |
| 4 | 2.16 |
| 5 | 1.96 |
| 6 | 1.84 |
| 7 | 1.50 |
| 8 | 0.75 |
| 9 | 0.94 |
| 10 | 0.70 |
| 11 | 1.54 |
| 12 | 0.49 |
| 13 | 0.28 |
| 14 | 0.76 |
| 15 | 1.27 |
| 16 | 0.21 |
| 17 | 0.12 |
| 18 | 0.95 |
| 19 | 0.33 |
| 20 | 1.16 |
Underneath the single-name noise, the market leg is waking up. It explains 11.8% of today's cross-sectional variance against 6.0% in Friday's session and a 9.6% one-year average, and the session-so-far correlation reading of 11.5% is the highest since July 9. The 5-day realized correlation gauge sits at 8.9% and crossed back above its 3-month median today, from the 49th percentile of the past three months to the 60th. The 20-day blend is still only 6.1% — the 0.9th percentile since 2020, with the like-for-like large-cap series at 8.3% — so this is a lift off the lows rather than a return to normal, and the options market has not priced it: implied 1-month single-stock correlation (Cboe COR1M) is 5.13, the lowest 0.4% of its 20-year history, and implied index volatility (Cboe VIX) fell to 15.56. Dispersion is still where the risk is priced — implied dispersion (Cboe DSPX) at 42.15 sits in its 98.7th percentile — but a beta-led bid is precisely the mechanism that drags single stocks back onto the index.
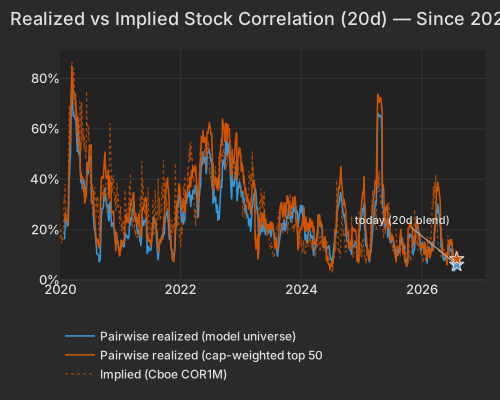
| Series | Today Pct | Prev Close Pct |
|---|---|---|
| pairwise_model | 6.10 | 5.70 |
| pairwise_top500 | 8.31 | 7.00 |
| implied_cor1m |
The single-name tape ran on its own fuel. AstraZeneca fell -7.40%, its largest stock-specific decline in a year, on reports it is weighing a bid for Bristol-Myers Squibb — Bloomberg Intelligence's Sam Fazeli said the deal "makes no sense"Bloomberg; the International factor at -0.60% (z=-2.0) marks US-listed international names lagging US-headquartered ones, and AstraZeneca is the extreme case. Atkore is +28.21% on Prysmian's agreement to acquire itBloomberg, Ferguson +8.19% on S&P 500 inclusion and a $2bn buybackBloomberg, and Boeing +6.44% after the FAA certified the 737-7. On the other side, Marriott is -6.85% after a revenue miss and Q3 guidance of $2.74–$2.82 against a $2.87 estimate, and GameStop -13.30% on a $1.4bn dilutive debt exchangeBloomberg. Palantir, +2.23% into the print, reports after the close with NHS England set to revise efficiency data on its £330mn Federated Data PlatformFT — a high-beta software name reporting into exactly the trade that just repriced upward.
The ISM Manufacturing report, released at 10:00 AM ET, showed the July headline PMI at 55.6 against a 54.0 consensus — the fastest expansion since May 2022 — with production at 58.5, new orders at 56.7 and employment back in expansion at 52.8 for the first time in 33 months; ISM chair Susan Spence attributed the broadening to demand for AI infrastructure and defense-related semiconductor products. The dollar index held just under 100 on the printCNBC, while the 2-year yield fell 3.5 bps and the 7-year 6.2 bpsCNBC — the belly of the curve, not the front end, doing the work as the Middle East risk premium came out of rates.
Variance decomposition: live intraday — 20260803 session, bracketed against its trailing-year range. Factor returns are trailing through last close. Total cross-sectional dispersion: 67%ile of the past year.
Variance mix — % of total, today vs 1d ago vs 1-yr avg
market 76%ile style 90%ile thematic 51%ile idiosyncratic 17%ile
Variance explained — today vs. factor's trailing-year range
Marker = the factor's share of today's total variance, placed in its own trailing-year range (box 25–75%ile, ticks 90%ile and max). Amber marker = unusually load-bearing today (≥90%ile of its own year). Factor name green = up today / red = down.
Correlation & dispersion — realized vs implied
Pairwise realized correlation (20d): 6.10% 0.9%ile since 2020 · 24%ile 3m
Top-500 pairwise: 8.31% 4.4%ile since 2020 · 25%ile 3m · implied (Cboe COR1M): 5.13 0.3%ile of its own history (gap +3.2pp)
5-day gauge: 8.88% — 60%ile of the past 3 months (lifting off the record lows)
Realized 20d vol (ann. pts): all stocks 49 vs VIXEQ 45 · index 11 vs VIX 16 · style factors 30 97.8%ile
20-day window (19 completed days + today); percentiles vs model history since 2020; '3m' tokens rank vs the trailing 63 trading days; definitions in Terms below. Implied prints (Cboe) are delayed ~15 min. as of 13:21 ET
Top 50 high-beta momentum names (eq-wt, since-2020 rank): +4.8% 96.2%ile · rest of market +0.8%
| Factor | Today | 1d | 5d | 20d | 60d |
|---|---|---|---|---|---|
| Style-Risk | |||||
| International | -0.60% z-1.9 | -0.25% | -0.18% | +0.47% | -1.77% |
| Residual Volatility | +0.78% z+1.6 | +0.06% | +1.59% | +0.11% | -0.55% |
| Beta | +1.42% z+1.4 | +0.08% | +0.77% | -6.00% | -4.73% |
| Style | |||||
| Profitability | -0.29% z-1.5 | -0.01% | -0.41% | +0.24% | -0.75% |
| Liquidity | +0.41% z+1.4 | -0.18% | +0.43% | +0.54% | -1.36% |
| Leverage | -0.18% z-1.0 | -0.31% | -0.92% | -1.00% | -1.60% |
| Value | +0.17% z+0.7 | +0.26% | +0.27% | +1.41% | -0.51% |
| Growth | +0.14% z+0.6 | +0.06% | +0.24% | +0.84% | +2.83% |
| Dividend Yield | -0.08% z-0.4 | -0.14% | -0.60% | -0.15% | -0.63% |
| Size | -0.12% z-0.3 | +0.65% | +0.65% | +0.17% | -0.19% |
| Style-Momentum | |||||
| One-Day Momentum | +0.57% z+2.0 | +0.09% | +1.99% | +0.75% | +4.54% |
| Long-Term Momentum | -1.04% z-1.6 | -0.33% | -1.68% | -3.09% | -3.61% |
| Short-Term Momentum | +0.25% z+0.8 | -0.56% | -2.20% | -5.31% | -6.52% |
| Medium-Term Momentum | -0.12% z-0.4 | -0.06% | +0.61% | -0.91% | +2.14% |
| Style-Positioning | |||||
| Hedge-Fund Ownership | +0.15% z+1.4 | -0.02% | +0.16% | +0.23% | -0.50% |
| Short Interest | +0.01% z+0.1 | -0.19% | -0.12% | -0.55% | +1.11% |
| Style-Flow | |||||
| Morning Activity | +0.16% z+1.2 | -0.11% | +0.71% | +0.30% | -0.58% |
| Short-Sale Activity | +0.05% z+0.4 | -0.03% | -0.02% | -0.23% | -0.61% |
| Thematic | |||||
| Semiconductors | -1.09% z-1.8 | +0.05% | -1.98% | -2.77% | -5.51% |
| Bitcoin / Crypto | -0.26% z-0.9 | -0.30% | +0.13% | -0.35% | -0.74% |
| Treasury (Duration) | -0.28% z-0.8 | -0.18% | -0.36% | +0.81% | +0.08% |
| Gold | -0.21% z-0.7 | -0.80% | -1.17% | -0.38% | -4.18% |
| China | -0.09% z-0.2 | +0.39% | +0.56% | +1.48% | -3.39% |
| Oil | +0.00% z+0.0 | +0.75% | +1.35% | +2.01% | -0.83% |
5/20/60d windows include today's session; 1d is the previous session.
Market variance share. The fraction of cross-sectional variance explained by the market factor — the attribution companion to pairwise correlation, not a substitute for it.
Factor z-score. Today's factor return divided by its daily-return standard deviation over ~1,600 trading days.
High-beta momentum cohort. US names above $2B market cap in the top quintile of both raw beta and 12-month momentum; membership frozen at each month's first business day. “Top 50” = the 50 strongest by combined rank.
Dispersion (realized). Total cross-sectional volatility net of the market component; high dispersion is the flip side of low correlation.
Stock-specific (idiosyncratic) return. The part of a stock's move not explained by market, style, or thematic factors in our decomposition.
VIXEQ / DSPX / COR1M. Cboe implied indices: single-stock volatility, dispersion, and 1-month implied correlation (top-50 S&P names). Quotes delayed ~15 minutes.
Data compiled by FactorPulse AI; edited and verified by Jeff Klein. For informational purposes only. Does not constitute financial advice, an investment recommendation, or an offer to buy or sell any securities. Always consult a qualified financial professional before making investment decisions.
For more on factor construction methodology, see www.factorpulse.com/glossary.