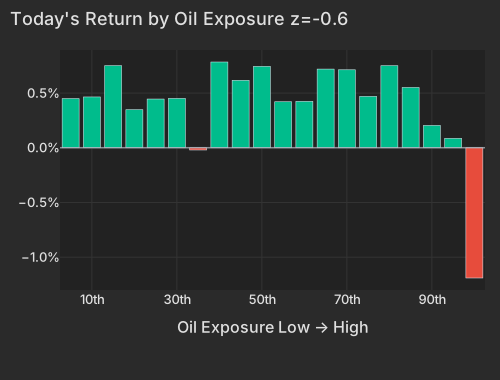
The war premium built over the past month is coming out in one move. Iranian Foreign Minister Araghchi says the Tehran–Muscat talks on the Strait of Hormuz are in their final stagesBloomberg, and the Oil factor is -0.28% (z=-0.6) — small in basis points, but a clean reversal of the trade that has run for weeks: Oil returned +1.73% over the past twenty sessions and XOP is +14.72% over the same stretch. The damage is concentrated rather than broad, with the most oil-exposed group down -1.19% and Energy's biggest names carrying it (XOM -1.15%, SHEL -1.28%, YPF -1.85%). Duration is paid on the same headline: the 10-year yields 4.68%, down 6.5bps, with the belly leading at 7.3bps on the 7-yearCNBC. The dollar is the other side of the weekend's news — it broke below 160 yen after the first joint US–Japan intervention in fifteen yearsBloomberg, leaving DXY at 99.84, -0.08%CNBC.
| ETF | Theme | Today | 1d Ago | 5d Ago | 20d Ago | 63d Ago |
|---|---|---|---|---|---|---|
| USO | oil | -5.88% | +1.33% | -5.50% | +24.23% | -12.18% |
| XOP | oil E&P | -1.58% | +1.45% | +1.92% | +14.72% | -0.45% |
| XLE | energy | -0.92% | +1.00% | -0.12% | +11.89% | -0.17% |
| DRAM | memory chips & storage | -2.45% | -3.76% | -5.32% | -16.92% | +28.07% |
| SMH | semiconductors | -1.14% | +0.30% | -3.68% | -8.74% | +6.67% |
| MTUM | momentum | -0.53% | +0.27% | -2.22% | -5.35% | +5.50% |
| IGV | software | +2.14% | +1.36% | +7.50% | +1.08% | +12.72% |
| DIA | mega cap | +1.03% | +0.54% | +1.07% | -0.67% | +5.57% |
| TLT | long-term bonds | +0.46% | -0.66% | -1.20% | -3.81% | -3.94% |
| VXX | volatility futures | -1.34% | -2.61% | -4.96% | -3.58% | -24.62% |
| Bucket | Avg Ret Pct |
|---|---|
| 1 | 0.45 |
| 2 | 0.46 |
| 3 | 0.75 |
| 4 | 0.35 |
| 5 | 0.45 |
| 6 | 0.45 |
| 7 | -0.02 |
| 8 | 0.78 |
| 9 | 0.62 |
| 10 | 0.74 |
| 11 | 0.42 |
| 12 | 0.42 |
| 13 | 0.72 |
| 14 | 0.71 |
| 15 | 0.47 |
| 16 | 0.75 |
| 17 | 0.55 |
| 18 | 0.20 |
| 19 | 0.09 |
| 20 | -1.19 |
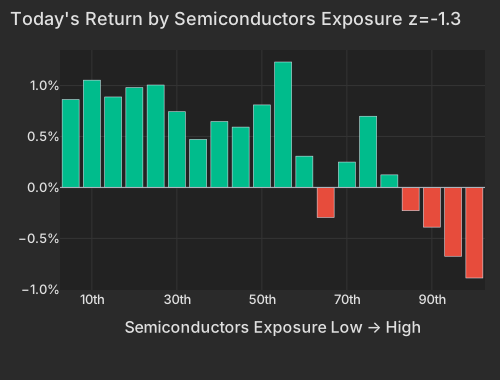
Semiconductors is down -0.78% (z=-1.3) on a conditional importance of 0.67 — the highest in the bundle, and the third down day in five. This is continuation, not a new break: the factor has returned -1.66% over five sessions and -2.46% over twenty. Memory chips are the sharp end, with the most-exposed memory and storage names down -3.54%, the DRAM ETF -2.45% after -16.92% over twenty sessions, and SMH -1.14%. It started overnight in Seoul, where the Kospi fell more than 5% with Samsung Electronics and SK Hynix down 8% apieceEconomic Times. Here it is Micron -3.48%, SanDisk -4.02%, Tower Semiconductor -4.37%, AXT -4.39% and Lumentum -2.05%; ON Semiconductor is -1.45% after reporting before the open.
| Factor | Return | Z-Score | 5d Z | 20d Z | 63d Z | Category | Direction |
|---|---|---|---|---|---|---|---|
| Semiconductors | -0.78% | z=-1.3 | -1.2 | -0.9 | -0.7 | Thematic | Continuation |
| Long-Term Momentum | -0.56% | z=-0.9 | -0.8 | -0.9 | -0.3 | Style-Momentum | Continuation |
| Liquidity | -0.23% | z=-0.8 | -0.3 | -0.1 | -1.0 | Style | Continuation |
| Oil | -0.28% | z=-0.6 | +1.0 | +0.8 | -0.4 | Thematic | Reversal |
| Morning Activity | +0.15% | z=+1.2 | +2.4 | +0.5 | -0.5 | Style-Flow | Continuation |
| Short Interest | +0.08% | z=+0.5 | -0.1 | -0.6 | +1.1 | Style-Positioning | Counter to baseline |
| Hedge-Fund Ownership | +0.03% | z=+0.3 | +0.2 | +0.2 | -0.9 | Style-Positioning | Flat |
| Short-Sale Activity | +0.00% | z=+0.0 | -0.3 | -0.5 | -0.1 | Style-Flow | Flat |
| Bucket | Avg Ret Pct |
|---|---|
| 1 | 0.86 |
| 2 | 1.05 |
| 3 | 0.89 |
| 4 | 0.98 |
| 5 | 1.01 |
| 6 | 0.74 |
| 7 | 0.47 |
| 8 | 0.65 |
| 9 | 0.59 |
| 10 | 0.81 |
| 11 | 1.23 |
| 12 | 0.31 |
| 13 | -0.29 |
| 14 | 0.25 |
| 15 | 0.70 |
| 16 | 0.12 |
| 17 | -0.23 |
| 18 | -0.39 |
| 19 | -0.67 |
| 20 | -0.89 |
Micron's stock-specific component today is essentially zero; the same is true across SanDisk, AXT and Tower. Long-Term Momentum, down -0.56% (z=-0.9) and explaining 9.6% of today's cross-sectional variance — top decile against its own past year — is what is marking them lower, and it has returned -2.61% over twenty sessions against Beta's -7.61%. The exposure overlap between Long-Term Momentum and the high-beta momentum group runs 0.59, so these are one trade rather than two signals: the top 50 high-beta momentum names are -1.11% while the rest of the market is +0.51%. That is why a peace headline worth -5.88% on USO buys the memory complex nothing — the names are being sold for their momentum and beta characteristics, not for anything happening in the Gulf.
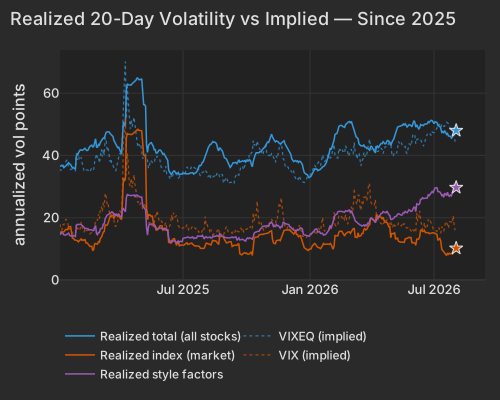
Two readings complicate it. Hedge-Fund Ownership is +0.03% (z=+0.3) and +0.08% on a raw basis, so the most hedge-fund-owned names are not being marked down even through their style tilts. Short-Term Momentum is +0.30% (z=+0.9) after returning -5.26% over twenty sessions, the first horizon in the momentum family to lift. Meanwhile the style block's realized 20-day variance stands at 29.7 vol points, the 97.5th percentile since 2020, against an index leg of 10.2 points at the 6.8th and implied index volatility at 15.99 — the churn is entirely underneath a calm headline market.
| Series | Today Vol Pts | Prev Close Vol Pts |
|---|---|---|
| total | 48.00 | 48.48 |
| market | 10.20 | 10.31 |
| style | 29.70 | 29.84 |
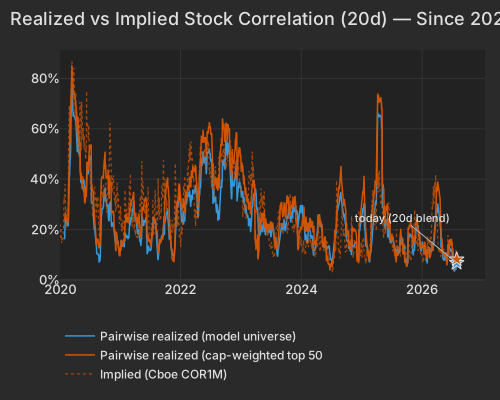
Realized 20-day pairwise correlation is 6.79%, the 1.1th percentile since 2020, and the like-for-like large-cap series is 8.17% at the 4.2nd — still pinned near the lows. The freshness clock is the one that moved: the 5-day gauge is 9.92%, back at the 65th percentile of the trailing three months from the 49th at Friday's close, the first sign the single-stock market is re-coupling. Implied 1-month single-stock correlation (Cboe COR1M) at 6.19 remains in the lowest 0.6% of its twenty-year history and implied dispersion (Cboe DSPX) at 41.42 sits in the 98th percentile, so options are still priced for names to go their own way. Pre-open marks are thin by construction, which is why the blends carry this claim and the session-so-far split does not.
| Series | Today Pct | Prev Close Pct |
|---|---|---|
| pairwise_model | 6.79 | 5.70 |
| pairwise_top500 | 8.17 | 7.00 |
| implied_cor1m |
Underneath, prices are being set name by name. Supernus is +18.75%, the largest stock-specific move in its trailing year, and Indivior +7.44% on the all-stock merger of equals the two announced in a joint release this morning. Bristol-Myers Squibb is +5.43% and AstraZeneca -4.55% after AstraZeneca was reported to be exploring a merger with itBloomberg. GameStop is -11.24% on a $1.4bn exchange of convertible notes for stock and Sportradar -13.89% on a second-quarter net lossBloomberg — each move almost wholly its own, none of it factor-carried. Berkshire Hathaway is +0.40% after reporting a record cash pile before the openFT; Marriott is -3.52% on its own pre-open results. One flow read worth flagging: the standing morning-intensity tilt is +0.15% (z=+1.2) with a five-day z of +2.4, so the habitually morning-heavy names — which skew retail and international — have outperformed all week. Palantir is +2.64% into an after-the-close report it has not yet delivered.
The ISM Manufacturing PMI is due at 10:00 AM ET, with consensus looking for 54.0 against June's 53.3 and the Prices Paid sub-index expected to ease to 70.3 from 73.0. The Employment index, last at 49.7, is the print that matters most for the rates market already 5–7bps lower on the Iran news; supply-chain disruption from the Gulf and tariff policy remain the stated downside risks.
Variance decomposition: live intraday — 20260803 session, bracketed against its trailing-year range. Factor returns are trailing through last close. Total cross-sectional dispersion: 2.8%ile of the past year.
Variance mix — % of total, today vs 1d ago vs 1-yr avg
market 55%ile style 64%ile thematic 85%ile idiosyncratic 40%ile
Variance explained — today vs. factor's trailing-year range
Marker = the factor's share of today's total variance, placed in its own trailing-year range (box 25–75%ile, ticks 90%ile and max). Amber marker = unusually load-bearing today (≥90%ile of its own year). Factor name green = up today / red = down.
Correlation & dispersion — realized vs implied
Pairwise realized correlation (20d): 6.79% 1.1%ile since 2020 · 24%ile 3m
Top-500 pairwise: 8.17% 4.2%ile since 2020 · 25%ile 3m · implied (Cboe COR1M): 6.19 0.6%ile of its own history (gap +2.0pp)
5-day gauge: 9.92% — 65%ile of the past 3 months (lifting off the record lows)
Realized 20d vol (ann. pts): all stocks 48 vs VIXEQ 44 · index 10 vs VIX 16 · style factors 30 97.5%ile
20-day window (19 completed days + today); percentiles vs model history since 2020; '3m' tokens rank vs the trailing 63 trading days; definitions in Terms below. Implied prints (Cboe) are delayed ~15 min. as of 07:21 ET
Top 50 high-beta momentum names (eq-wt, since-2020 rank): -1.1% 29%ile · rest of market +0.5%
| Factor | Today | 1d | 5d | 20d | 60d |
|---|---|---|---|---|---|
| Style-Risk | |||||
| International | -0.14% z-0.5 | -0.25% | +0.27% | +0.93% | -1.31% |
| Beta | -0.18% z-0.2 | +0.08% | -0.84% | -7.61% | -6.33% |
| Residual Volatility | +0.02% z+0.0 | +0.06% | +0.83% | -0.66% | -1.32% |
| Style | |||||
| Liquidity | -0.23% z-0.8 | -0.18% | -0.21% | -0.09% | -2.00% |
| Profitability | -0.14% z-0.8 | -0.01% | -0.27% | +0.38% | -0.61% |
| Dividend Yield | -0.10% z-0.5 | -0.14% | -0.62% | -0.17% | -0.65% |
| Leverage | -0.08% z-0.5 | -0.31% | -0.82% | -0.90% | -1.50% |
| Size | +0.07% z+0.2 | +0.65% | +0.84% | +0.36% | +0.00% |
| Value | -0.04% z-0.2 | +0.26% | +0.06% | +1.19% | -0.72% |
| Growth | +0.02% z+0.1 | +0.06% | +0.12% | +0.73% | +2.71% |
| Style-Momentum | |||||
| Short-Term Momentum | +0.30% z+0.9 | -0.56% | -2.16% | -5.26% | -6.47% |
| Long-Term Momentum | -0.56% z-0.9 | -0.33% | -1.21% | -2.61% | -3.13% |
| Medium-Term Momentum | -0.14% z-0.5 | -0.06% | +0.59% | -0.93% | +2.12% |
| One-Day Momentum | +0.06% z+0.2 | +0.09% | +1.48% | +0.24% | +4.03% |
| Style-Positioning | |||||
| Short Interest | +0.08% z+0.5 | -0.19% | -0.05% | -0.48% | +1.17% |
| Hedge-Fund Ownership | +0.03% z+0.3 | -0.02% | +0.04% | +0.12% | -0.61% |
| Style-Flow | |||||
| Morning Activity | +0.15% z+1.2 | -0.11% | +0.71% | +0.29% | -0.58% |
| Short-Sale Activity | +0.00% z+0.0 | -0.03% | -0.07% | -0.27% | -0.65% |
| Thematic | |||||
| Semiconductors | -0.78% z-1.3 | +0.05% | -1.66% | -2.46% | -5.19% |
| Bitcoin / Crypto | -0.19% z-0.6 | -0.30% | +0.20% | -0.28% | -0.67% |
| Oil | -0.28% z-0.6 | +0.75% | +1.06% | +1.73% | -1.11% |
| Gold | +0.12% z+0.4 | -0.80% | -0.84% | -0.05% | -3.85% |
| Treasury (Duration) | -0.11% z-0.3 | -0.18% | -0.19% | +0.97% | +0.24% |
| China | +0.02% z+0.0 | +0.39% | +0.67% | +1.59% | -3.28% |
5/20/60d windows include today's session; 1d is the previous session.
Pairwise realized correlation. Index variance net of the weighted idiosyncratic diagonal, over the cross terms — the estimator used for implied-correlation indices. 20-day window unless noted; history since 2020.
Factor z-score. Today's factor return divided by its daily-return standard deviation over ~1,600 trading days.
High-beta momentum cohort. US names above $2B market cap in the top quintile of both raw beta and 12-month momentum; membership frozen at each month's first business day. “Top 50” = the 50 strongest by combined rank.
Dispersion (realized). Total cross-sectional volatility net of the market component; high dispersion is the flip side of low correlation.
Stock-specific (idiosyncratic) return. The part of a stock's move not explained by market, style, or thematic factors in our decomposition.
VIXEQ / DSPX / COR1M. Cboe implied indices: single-stock volatility, dispersion, and 1-month implied correlation (top-50 S&P names). Quotes delayed ~15 minutes.
Data compiled by FactorPulse AI; edited and verified by Jeff Klein. For informational purposes only. Does not constitute financial advice, an investment recommendation, or an offer to buy or sell any securities. Always consult a qualified financial professional before making investment decisions.
For more on factor construction methodology, see www.factorpulse.com/glossary.