Trump's decision to call off strikes on Iran deflated oil and put a bid under the exact names July had discarded. The top 50 high-beta momentum names rose +5.39% — the 43rd best day of 1,653 since 2020 — against +1.05% for everything outside the screen, and the buying concentrated hardest in the names that fit the beta-and-momentum profile most tightly. It did not buy back the winners: Long-Term Momentum fell -1.11% (z=-1.7) with the worst 1-year laggards up +6.1%.
The event is clean. Trump halted planned strikes against Iran over the weekend and said formal negotiations resume Monday, with Iran confirming that talks with Oman on a Hormuz shipping route are in their final stagesNYTBloomberg. The war premium built through July came out in one session: USO -5.48% after +24.23% over the prior 20 days, with XOP -1.44% and XLE -1.30%. Rates followed — the 10-year at 4.688%, down 5.7bps, the 5-year down 6.2bpsCNBC — retreating from Friday's 18-month highEconomic Times. Equities took it broadly: SPY +1.50%, QQQ +1.83%. The dollar spent the morning at a session low of 99.418 after the first joint US–Japan yen intervention in fifteen yearsBloomberg, then closed the gap to 99.972 once the ISM print landedCNBC.
| Factor | Return | Z-Score | 5d Z | 20d Z | 63d Z | Category | Direction |
|---|---|---|---|---|---|---|---|
| Beta | +1.66% | z=+1.7 | +0.5 | -1.3 | -0.1 | Style-Risk | High-beta names led |
| Long-Term Momentum | -1.11% | z=-1.7 | -1.2 | -1.1 | -0.4 | Style-Momentum | 1-year laggards beat 1-year winners |
| Semiconductors | -1.05% | z=-1.7 | -1.4 | -1.0 | -0.8 | Thematic | Semis-exposed names lagged |
| International | -0.61% | z=-2.0 | -0.3 | +0.3 | -0.7 | Style-Risk | US-headquartered beat US-listed international |
| Morning Activity | +0.21% | z=+1.6 | +2.6 | +0.6 | -0.4 | Style-Flow | Habitually morning-heavy names led |
| Hedge-Fund Ownership | +0.12% | z=+1.1 | +0.5 | +0.4 | -0.8 | Style-Positioning | Hedge-fund-owned names led |
| Short Interest | -0.08% | z=-0.5 | -0.5 | -0.8 | +1.0 | Style-Positioning | Most-shorted names lagged |
| Short-Sale Activity | +0.05% | z=+0.5 | -0.1 | -0.4 | -0.1 | Style-Flow | Heavily short-sold names beat barely-shorted |
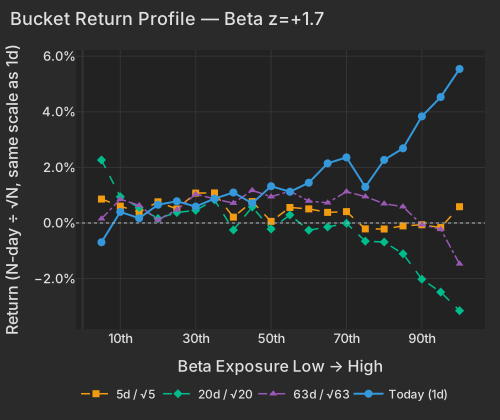
Beta is the transmission mechanism, and it is doing an unusual amount of the explaining: 44% conditional importance and 16.0% of today's cross-sectional variance. The top-beta bucket averaged +5.51%, led by Wolfspeed, POET, Everspin and Aehr. The purest illustration is the set of names where almost nothing was company-specific — Red Cat +9.58%, D-Wave +10.51%, Redwire +12.12%, Velo3D +12.30%, each carried by the day's beta complex rather than any news of its own.
| Bucket | Ret 1D Pct | Ret 5D Norm Pct | Ret 20D Norm Pct | Ret 63D Norm Pct |
|---|---|---|---|---|
| 1 | -0.69 | 0.86 | 2.27 | 0.15 |
| 2 | 0.40 | 0.61 | 0.94 | 0.86 |
| 3 | 0.17 | 0.38 | 0.55 | 0.63 |
| 4 | 0.66 | 0.76 | 0.16 | 0.11 |
| 5 | 0.78 | 0.50 | 0.38 | 0.47 |
| 6 | 0.59 | 1.08 | 0.45 | 1.03 |
| 7 | 0.88 | 1.08 | 0.83 | 0.87 |
| 8 | 1.10 | 0.21 | -0.25 | 0.71 |
| 9 | 0.71 | 0.77 | 0.58 | 1.17 |
| 10 | 1.32 | 0.06 | -0.22 | 0.94 |
| 11 | 1.12 | 0.56 | 0.29 | 1.15 |
| 12 | 1.45 | 0.51 | -0.26 | 0.79 |
| 13 | 2.15 | 0.38 | -0.14 | 0.73 |
| 14 | 2.36 | 0.41 | -0.01 | 1.13 |
| 15 | 1.30 | -0.21 | -0.65 | 0.95 |
| 16 | 2.27 | -0.22 | -0.69 | 0.69 |
| 17 | 2.69 | -0.11 | -1.11 | 0.59 |
| 18 | 3.84 | -0.06 | -2.02 | -0.06 |
| 19 | 4.53 | -0.16 | -2.49 | -0.23 |
| 20 | 5.54 | 0.59 | -3.15 | -1.47 |
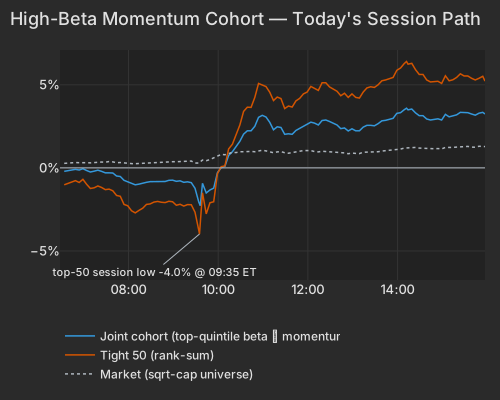
The crowded high-beta momentum cohort was where the day was won. The top 50 names went from -3.98% at 9:35 to a high of +6.40% at 14:12 and finished the session +5.39%; the broader group of roughly 190 names rose +3.32%, and stocks in neither screen managed +1.05%. The top-50 group moved 1.62× the broader group against a 1.14× norm, so the more tightly a name fit the beta-and-momentum profile, the harder it ran. That matters because of where it started: at Friday's close the same group sat 32.3% below its high. Goldman Sachs prime brokerage's report of the largest three-session global tech selling in its history, with hedge-fund gross leverage down to 309.8%, and Morgan Stanley Prime Brokerage's largest three-day gross reduction since 2021 both describe late July; the nearest lens our data offers on that window is Beta's -5.77% over the trailing 20 sessions, same direction, shorter clock.
Today the positioning lenses turn the other way. Hedge-Fund Ownership rose +0.12% (z=+1.1) and +0.27% on a raw basis (z=+1.9) — the names hedge funds own were in front, consistent with reports of funds re-grossing AI momentum exposure on the sessionBloomberg. The retail-skewing tilt worked alongside it: names that habitually run volume-heavy mornings gained +0.21% (z=+1.6), a five-day run at z=+2.6, and that tilt runs 1.15σ rich inside the top-50 group. Note also what Friday looked like: in that session the group traded on light volume, roughly 0.67× the broader tape's pace, and its members moved with normal dispersion rather than as one basket. A markdown on thin volume, then a 5%+ rebound — this is the first upside extreme after three downside extremes on July 28–30, which places today at the start of the repair, not in the middle of one.
| Series | Ret Pct |
|---|---|
| joint | 3.32 |
| tight50 | 5.39 |
| market | 1.29 |
| rest | 1.05 |
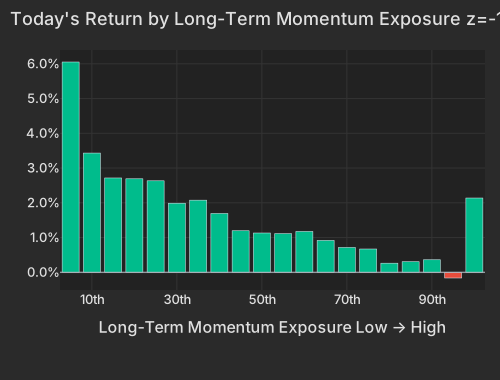
Here is the residual that the index-level story misses. Long-Term Momentum fell -1.11% (z=-1.7), four down days in the last five and -3.16% over 20 sessions — continuation, not a one-day shake. The move came from the left side: the worst 1-year laggards averaged +6.1%, names like NuScale, Nano Nuclear, Oklo and Super Micro. Uranium and nuclear confirm it with the sharpest reversal in the ETF set — URA +4.49% and NLR +4.41% today against -30.75% and -26.81% over 63 days. MTUM added only +0.74%. What repriced was the most damaged, highest-beta end of the market, not the 12-month leadership.
| Bucket | Avg Ret Pct |
|---|---|
| 1 | 6.05 |
| 2 | 3.43 |
| 3 | 2.71 |
| 4 | 2.69 |
| 5 | 2.63 |
| 6 | 1.99 |
| 7 | 2.08 |
| 8 | 1.69 |
| 9 | 1.20 |
| 10 | 1.13 |
| 11 | 1.11 |
| 12 | 1.18 |
| 13 | 0.92 |
| 14 | 0.71 |
| 15 | 0.67 |
| 16 | 0.26 |
| 17 | 0.30 |
| 18 | 0.36 |
| 19 | -0.16 |
| 20 | 2.14 |
Semiconductors is the factor that refused to join. It fell -1.05% (z=-1.7) on a day nearly everything rose, extending -2.73% over 20 sessions and -5.46% over 60, with negative horizon z-scores at every window. SMH's +1.02% badly trailed QQQ, and the memory and storage names inside the highest-semis bucket fell -3.54% on a weighted basis while the rest of the bucket-20 complex was flat to lower. DRAM's +1.55% is cold comfort against -16.92% over 20 days. Western Digital and SanDisk report Wednesday, and Korea set the tone overnight: the Kospi slumped 5% with Samsung Electronics and SK Hynix each down 8%Economic Times, attributed in part to leveraged-ETF unwinding that banks are now hedging with crash putsBloomberg. The US-listed proxy went the other way: EWY +2.50%.
| ETF | Theme | Today | 1d Ago | 5d Ago | 20d Ago | 63d Ago |
|---|---|---|---|---|---|---|
| USO | oil | -5.48% | +1.33% | -5.50% | +24.23% | -12.18% |
| XOP | oil E&P | -1.44% | +1.45% | +1.92% | +14.72% | -0.45% |
| URA | uranium | +4.49% | -1.64% | -2.06% | -9.62% | -30.75% |
| NLR | nuclear power | +4.41% | -1.41% | -1.17% | -7.05% | -26.81% |
| ARKK | innovation growth | +3.57% | -2.28% | -0.90% | -12.32% | -6.07% |
| IGV | software | +3.84% | +1.36% | +7.50% | +1.08% | +12.72% |
| SMH | semiconductors | +1.02% | +0.30% | -3.68% | -8.74% | +6.67% |
| DRAM | memory chips & storage | +1.55% | -3.76% | -5.32% | -16.92% | +28.07% |
| MTUM | momentum | +0.74% | +0.27% | -2.22% | -5.35% | +5.50% |
| QQQ | large cap growth | +1.83% | +0.65% | +0.55% | -3.45% | +3.03% |
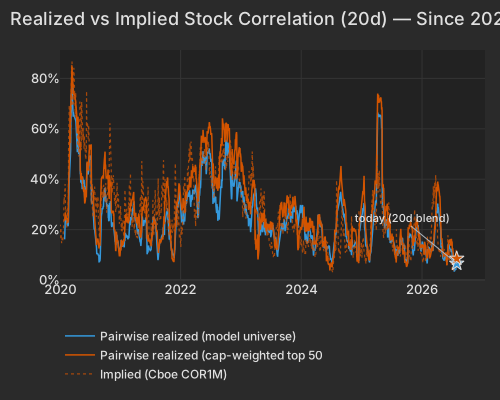
A single macro catalyst re-coupled a market that had spent weeks trading name by name. The index explained 16.2% of cross-sectional variance today against 6.0% on Friday and a 9.6% one-year average, and realized correlation for the session ran 17.6%, its highest since June 11 and the 69th percentile since 2020. The slower gauges have not caught up: 20-day realized pairwise correlation sits at 6.55%, the 1.0th percentile since 2020, though the 5-day gauge crossed back above its three-month median today, at the 65.1st percentile of the past 63 sessions from 49.2 on Friday. Implied is priced for the opposite. Cboe's implied 1-month single-stock correlation (COR1M) fell to 5.6, inside the lowest 0.5% of its 20-year history, and implied dispersion (DSPX) at 42.03 ranks in the 98.6th percentile of its own history. That gap is where the risk sits for anyone short index vol and long single-stock vol: blended 20-day style volatility is 30.2 vol points (97.8th percentile) against market volatility of 11.1 (13.7th), and VIX at 15.77 (37th percentile) against implied single-stock volatility of 44.89 (95th).
| Series | Today Pct | Prev Close Pct |
|---|---|---|
| pairwise_model | 6.55 | 5.70 |
| pairwise_top500 | 8.50 | 7.00 |
| implied_cor1m |
Palantir closed the regular session +2.27% and added +8.16% after the bell on revenue of $1.94bn, up 93%, with US commercial revenue up 149% and full-year guidance raised to about $8.16bnCNBCBloomberg; the stock's own move accounted for +7.1 points of it, the 98th percentile of its trailing year. Snap rose +7.76% in the session and a further +12.01% late — a name that carries the day's winning profile in its exposures, sitting 2.1σ below average on 1-year momentum and 3.7σ below on semiconductors, though most of the move was its own. Inspire Medical added +4.04% then +14.46% after the bell; its release showed adjusted EPS of $0.14 against a consensus loss of $0.24 and full-year revenue guidance lifted to $835–875 million (GlobeNewswire, Aug 3).
The losers were all their own doing. AstraZeneca fell -6.47% on reports it is exploring a Bristol-Myers Squibb acquisitionBloomberg, a 4.3-sigma idiosyncratic drop and the largest single weight behind International's z=-2.0, where US-headquartered names beat the US-listed international segment. GameStop dropped -12.27% on a $1.4bn debt-for-equity exchangeEconomic Times; with a 3.2σ short-interest exposure and Short Interest itself at only -0.08%, the dilution did that, not positioning. Sportradar fell -15.08% on a guidance cut. And the day's neatest irony: Marriott fell -6.93% on revenue of $7.07bn against a $7.17bn estimate, dragged by a 43% collapse in Middle East RevPAR (PR Newswire, Aug 3) — the tape stopped pricing the Middle East risk on the same day one company reported the bill for it.
The ISM Manufacturing report, released at 10:00 AM ET, printed 55.6 against a 54.0 consensus and 53.3 in June — the fastest expansion in over four years — with production at 58.5, new orders at 56.7 and the employment index at 52.8, in expansion for the first time in 33 months, per the Institute for Supply Management. The strength is what pulled the dollar index back to 99.972 after the morning's intervention-driven low, and it leaves the front end of the curve doing something the long end is not: the 2-year fell 3.9bps while the 30-year fell 4.1bps and sits at 5.234%CNBC.
Variance decomposition: live intraday — 20260803 session, bracketed against its trailing-year range. Factor returns are trailing through last close. Total cross-sectional dispersion: 80%ile of the past year.
Variance mix — % of total, today vs 1d ago vs 1-yr avg
market 83%ile style 86%ile thematic 38%ile idiosyncratic 16%ile
Variance explained — today vs. factor's trailing-year range
Marker = the factor's share of today's total variance, placed in its own trailing-year range (box 25–75%ile, ticks 90%ile and max). Amber marker = unusually load-bearing today (≥90%ile of its own year). Factor name green = up today / red = down.
Correlation & dispersion — realized vs implied
Pairwise realized correlation (20d): 6.55% 1.0%ile since 2020 · 24%ile 3m
Top-500 pairwise: 8.50% 4.5%ile since 2020 · 25%ile 3m · implied (Cboe COR1M): 5.60 0.5%ile of its own history (gap +2.9pp)
5-day gauge: 10.18% — 65%ile of the past 3 months (lifting off the record lows)
Realized 20d vol (ann. pts): all stocks 49 vs VIXEQ 45 · index 11 vs VIX 16 · style factors 30 97.8%ile
20-day window (19 completed days + today); percentiles vs model history since 2020; '3m' tokens rank vs the trailing 63 trading days; definitions in Terms below. Implied prints (Cboe) are delayed ~15 min. as of 15:58 ET
Top 50 high-beta momentum names (eq-wt, since-2020 rank): +5.4% 97.5%ile · rest of market +1.1%
| Factor | Today | 1d | 5d | 20d | 60d |
|---|---|---|---|---|---|
| Style-Risk | |||||
| International | -0.61% z-2.0 | -0.25% | -0.19% | +0.47% | -1.77% |
| Beta | +1.66% z+1.7 | +0.08% | +1.00% | -5.77% | -4.49% |
| Residual Volatility | +0.63% z+1.2 | +0.06% | +1.44% | -0.05% | -0.71% |
| Style | |||||
| Profitability | -0.29% z-1.5 | -0.01% | -0.42% | +0.23% | -0.76% |
| Liquidity | +0.33% z+1.2 | -0.18% | +0.35% | +0.46% | -1.44% |
| Growth | +0.17% z+0.7 | +0.06% | +0.26% | +0.87% | +2.85% |
| Leverage | -0.10% z-0.6 | -0.31% | -0.84% | -0.93% | -1.52% |
| Value | +0.14% z+0.6 | +0.26% | +0.23% | +1.37% | -0.55% |
| Size | -0.19% z-0.5 | +0.65% | +0.57% | +0.10% | -0.26% |
| Dividend Yield | -0.02% z-0.1 | -0.14% | -0.54% | -0.09% | -0.57% |
| Style-Momentum | |||||
| One-Day Momentum | +0.52% z+1.8 | +0.09% | +1.93% | +0.70% | +4.49% |
| Long-Term Momentum | -1.11% z-1.7 | -0.33% | -1.76% | -3.16% | -3.68% |
| Medium-Term Momentum | -0.19% z-0.7 | -0.06% | +0.54% | -0.98% | +2.07% |
| Short-Term Momentum | +0.09% z+0.3 | -0.56% | -2.36% | -5.47% | -6.67% |
| Style-Positioning | |||||
| Hedge-Fund Ownership | +0.12% z+1.1 | -0.02% | +0.13% | +0.20% | -0.53% |
| Short Interest | -0.08% z-0.5 | -0.19% | -0.21% | -0.64% | +1.02% |
| Style-Flow | |||||
| Morning Activity | +0.21% z+1.6 | -0.11% | +0.76% | +0.34% | -0.53% |
| Short-Sale Activity | +0.05% z+0.5 | -0.03% | -0.02% | -0.22% | -0.60% |
| Thematic | |||||
| Semiconductors | -1.05% z-1.7 | +0.05% | -1.94% | -2.73% | -5.46% |
| Bitcoin / Crypto | -0.29% z-1.0 | -0.30% | +0.10% | -0.39% | -0.77% |
| Treasury (Duration) | -0.22% z-0.7 | -0.18% | -0.30% | +0.86% | +0.13% |
| Gold | -0.19% z-0.6 | -0.80% | -1.15% | -0.36% | -4.17% |
| China | -0.18% z-0.4 | +0.39% | +0.47% | +1.39% | -3.47% |
| Oil | -0.19% z-0.4 | +0.75% | +1.15% | +1.82% | -1.02% |
5/20/60d windows include today's session; 1d is the previous session.
Pairwise realized correlation. Index variance net of the weighted idiosyncratic diagonal, over the cross terms — the estimator used for implied-correlation indices. 20-day window unless noted; history since 2020.
Market variance share. The fraction of cross-sectional variance explained by the market factor — the attribution companion to pairwise correlation, not a substitute for it.
Factor z-score. Today's factor return divided by its daily-return standard deviation over ~1,600 trading days.
High-beta momentum cohort. US names above $2B market cap in the top quintile of both raw beta and 12-month momentum; membership frozen at each month's first business day. “Top 50” = the 50 strongest by combined rank.
Dispersion (realized). Total cross-sectional volatility net of the market component; high dispersion is the flip side of low correlation.
Stock-specific (idiosyncratic) return. The part of a stock's move not explained by market, style, or thematic factors in our decomposition.
VIXEQ / DSPX / COR1M. Cboe implied indices: single-stock volatility, dispersion, and 1-month implied correlation (top-50 S&P names). Quotes delayed ~15 minutes.
Data compiled by FactorPulse AI; edited and verified by Jeff Klein. For informational purposes only. Does not constitute financial advice, an investment recommendation, or an offer to buy or sell any securities. Always consult a qualified financial professional before making investment decisions.
For more on factor construction methodology, see www.factorpulse.com/glossary.