Prices are being set stock by stock today, not by the factor complex: 84.8% of cross-sectional variance is idiosyncratic against a 67.2% one-year average, the market leg explains 1.0%, and the style block has fallen to 9.9% from 36.0% yesterday. Amazon at +13.48% and Apple at -9.41% are each nearly pure own-move, and SPY sits unchanged at +0.01% with both of them in it. Only two factors are carrying real weight — Gold at z=-2.6 and Short-Term Momentum at z=-2.6, its fifth straight down session.
Apple's decline is the largest stock-specific move in its trailing year, 5.4 standard deviations of own-move and $454bn of market capitalisation, on current-quarter revenue guidance of 9–11% against a 12% expectation plus memory and chip-capacity constraintsCNBC; Tim Cook called memory pricing a "100-year flood"CNBC. Amazon's is 9.4 standard deviations the other way, on 37% year-on-year cloud growth and a 2026 capital-expenditure plan raised to $220bn from $200bnCNBC. The same memory bill sits on both sides of that gap — one company is paying it to sell cloud capacity, the other to sell hardware — and the market is paying up only for the first, with Meta's cash generation down 91% and Amazon's trailing free cash flow at negative $7.6bn showing what the buildout costsCNBC.
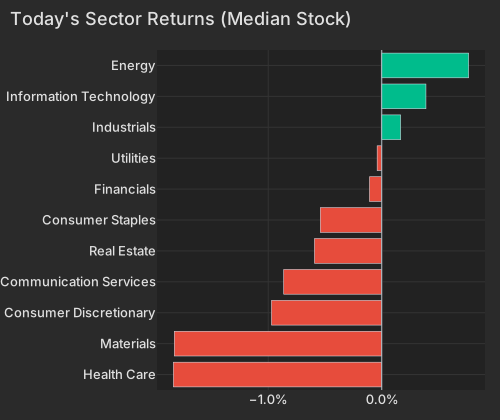
The spread runs well past the two mega-caps. Roblox -30.07% after guiding third-quarter bookings below consensus and pulling its full-year outlook; Reddit -23.80% despite beating on revenue and earnings, with management flagging choppy search referrals; Veracyte -24.78% after raising guidance; GoDaddy -20.47% on a trimmed full-year revenue rangeBloomberg. Two construction-and-engineering names with the same data-center end market sit 49 points apart: IES Holdings +31.31% on record results and a two-for-one splitthe SEC, MasTec -17.72% on communications work deferred into 2027Bloomberg. Both are stock-specific to the point where the factor contribution is a rounding error. Underneath the flat index, the median stock is lower in most sectors, Health Care and Materials both at -1.91%.
| Sector | Median Ret Pct |
|---|---|
| Health Care | -1.84 |
| Materials | -1.83 |
| Consumer Discretionary | -0.97 |
| Communication Services | -0.86 |
| Real Estate | -0.59 |
| Consumer Staples | -0.54 |
| Financials | -0.11 |
| Utilities | -0.04 |
| Industrials | 0.17 |
| Information Technology | 0.39 |
| Energy | 0.77 |
| Factor | Return | Z-Score | 5d Z | 20d Z | 63d Z | Category | Direction |
|---|---|---|---|---|---|---|---|
| Gold | -0.85% | z=-2.6 | z=-1.5 | -0.2 | z=-1.6 | Thematic | Gold-exposed names lagged |
| Short-Term Momentum | -0.88% | z=-2.6 | z=-4.9 | z=-3.9 | z=-2.6 | Style-Momentum | Prior-week winners gave back |
| Morning Activity | -0.24% | z=-1.9 | z=+1.5 | 0.0 | -0.9 | Style-Flow | Habitual morning-heavy names lagged |
| Short Interest | -0.31% | z=-1.8 | -0.2 | -1.0 | 0.9 | Style-Positioning | Most-shorted lagged, no squeeze |
| Size | +0.54% | z=+1.5 | 0.2 | 0.3 | 0.0 | Style | Larger caps led |
| Semiconductors | +0.61% | z=+1.0 | z=-1.7 | -0.4 | -0.5 | Thematic | Chip-exposed names led |
Gold carries a fifth of the day's conditional importance and the pressure is concentrated in the most-exposed names: GDX -3.55%, SLV -2.98%, GLD -1.71%, AngloGold -7.12%. Centerra Gold -4.82% did nothing of its own — the factor did all of it. The driver is the dollar and the consumer: DXY firmed +0.41% to 100.28CNBC, and final July Michigan sentiment came in at a five-month high of 55.2 with one-year inflation expectations easing to 4.2%Bloomberg. GDX had been +2.35% over five sessions and +2.28% over 20 coming in, so this cuts the recent bounce rather than deepening the -10.95% 63-day slide.
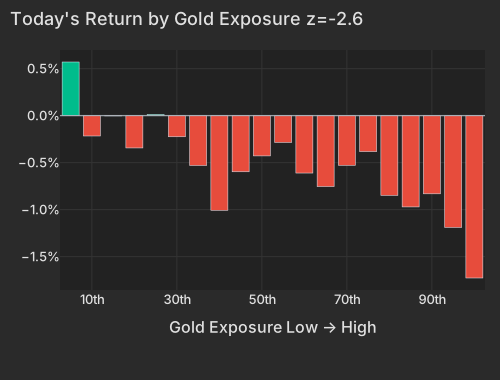
| Bucket | Avg Ret Pct |
|---|---|
| 1 | 0.57 |
| 2 | -0.22 |
| 3 | -0.00 |
| 4 | -0.34 |
| 5 | 0.01 |
| 6 | -0.23 |
| 7 | -0.53 |
| 8 | -1.01 |
| 9 | -0.60 |
| 10 | -0.43 |
| 11 | -0.29 |
| 12 | -0.61 |
| 13 | -0.75 |
| 14 | -0.53 |
| 15 | -0.38 |
| 16 | -0.85 |
| 17 | -0.97 |
| 18 | -0.83 |
| 19 | -1.19 |
| 20 | -1.73 |
Rates moved and the cross-section ignored it. The curve lifted about six basis points at every tenor — 2-year 4.287%, 10-year 4.724%, 30-year 5.259%CNBC — capping a month in which the 10-year added 22.5 basis points, the largest monthly rise since MarchEconomic Times. TLT is -0.84% and LQD -0.36%, yet the Treasury duration factor is flat at z=-0.3: the bond move is being expressed in bonds, not in equity duration exposure.
The second live factor has been live all month. Short-Term Momentum is z=-2.6 today for a fifth consecutive down session, -3.70% over five days and -5.94% over 20, with trailing readings of z=-4.9 at five days, z=-3.9 at 20 and z=-2.6 at 63. Anything that ran over the prior week is getting sold the next day, and it has been true for a month: today the strongest prior-week gainers — RingCentral, JetBlue, Fastly, AMC — fell -1.76% as a group while the worst prior-week performers gained +0.80%. MTUM is +0.40% today against -8.94% over 20 sessions. Read from the other end, the 50 most crowded high-beta momentum names rose +2.18% while the rest of the universe fell -0.63%; those names sit at the bottom of the Short-Term Momentum exposure range, so that is the same reversal seen from the long side, not a separate signal.
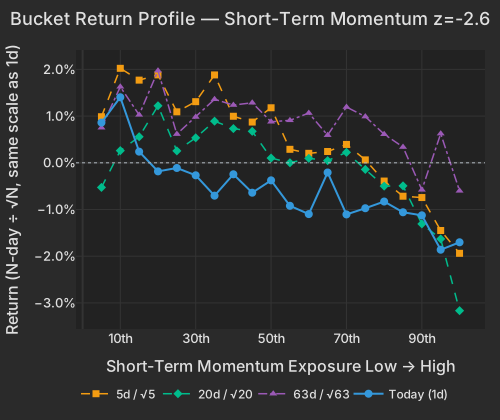
| Bucket | Ret 1D Pct | Ret 5D Norm Pct | Ret 20D Norm Pct | Ret 63D Norm Pct |
|---|---|---|---|---|
| 1 | 0.86 | 0.99 | -0.53 | 0.75 |
| 2 | 1.40 | 2.02 | 0.26 | 1.63 |
| 3 | 0.24 | 1.77 | 0.56 | 1.03 |
| 4 | -0.18 | 1.88 | 1.22 | 1.97 |
| 5 | -0.11 | 1.09 | 0.26 | 0.62 |
| 6 | -0.27 | 1.31 | 0.54 | 0.98 |
| 7 | -0.70 | 1.88 | 0.89 | 1.36 |
| 8 | -0.25 | 1.00 | 0.73 | 1.24 |
| 9 | -0.64 | 0.87 | 0.67 | 1.29 |
| 10 | -0.38 | 1.18 | 0.10 | 0.88 |
| 11 | -0.92 | 0.29 | 0.00 | 0.91 |
| 12 | -1.10 | 0.20 | 0.10 | 1.07 |
| 13 | -0.21 | 0.24 | 0.05 | 0.59 |
| 14 | -1.10 | 0.39 | 0.22 | 1.19 |
| 15 | -0.97 | 0.06 | -0.14 | 0.99 |
| 16 | -0.83 | -0.39 | -0.50 | 0.61 |
| 17 | -1.06 | -0.72 | -0.49 | 0.34 |
| 18 | -1.12 | -0.74 | -1.31 | -0.58 |
| 19 | -1.86 | -1.45 | -1.63 | 0.62 |
| 20 | -1.70 | -1.94 | -3.17 | -0.60 |
The most heavily shorted names underperformed again at z=-1.8, with biotech and China ADRs the concentration — XBI -3.41% on a day AbbVie cut full-year adjusted EPS guidance to absorb its $10.9bn Apogee purchase and Replimune ran +90.22% after an FDA panel backed RP1WSJ. Names that habitually trade volume-heavy mornings, a group skewing retail and international, also lagged at z=-1.9, alongside Korea and Japan handing back part of yesterday's chip-led surge: EWY -2.16% after +11.79%, the KOSPI having risen 18% in a single sessionNYT. Memory itself is where the giveback bites hardest: DRAM -3.17% today after +16.70% yesterday, and still +36.91% over 63 days.
| ETF | Theme | Today | 1d Ago | 5d Ago | 20d Ago | 63d Ago |
|---|---|---|---|---|---|---|
| XLY | consumer discretionary | +2.45% | +0.70% | +3.34% | -4.83% | -3.81% |
| SMH | semiconductors | +0.27% | +6.88% | -7.11% | -13.15% | +7.87% |
| SPY | large cap | +0.01% | +1.68% | +0.48% | -0.55% | +4.23% |
| XLK | technology | -1.05% | +5.50% | -1.52% | -5.33% | +10.45% |
| TLT | long-term bonds | -0.84% | -0.06% | -0.44% | -3.18% | -3.38% |
| EWY | south korea | -2.16% | +11.79% | -7.28% | -13.09% | +4.71% |
| DRAM | memory chips & storage | -3.17% | +16.70% | -10.22% | -20.53% | +36.91% |
| XBI | biotech growth | -3.41% | +2.40% | -0.51% | -3.25% | +17.50% |
| GDX | gold miners | -3.55% | +4.36% | +2.35% | +2.28% | -10.95% |
| ARKK | innovation growth | -3.74% | +3.29% | -1.26% | -10.93% | -0.86% |
None of this says factor risk has gone away, and a book that reads today's variance mix as an all-clear will be wrong. On the 20-day blend, style variance stands at 29.9 volatility points, the 97.7th percentile since 2020, with Beta alone at 23.4 points (98.8th) while the index leg sits at 10.4 points (7.9th) — the factor block has been doing near-record work all month underneath an index that barely moved, and style still accounts for 43.8% of variance over the last five sessions. Realized 20-day pairwise correlation has been sitting at 5.85%, the 0.9th percentile since 2020 though only the 22nd percentile against the past three months, and implied single-stock volatility at 44.78 against a VIX of 17.44 shows the options market still pricing single names to do the moving. Today's drop in the style share to 9.9% is what an earnings-verdict session looks like; the month's factor pressure has not been cleared, it has been outshouted for a day.
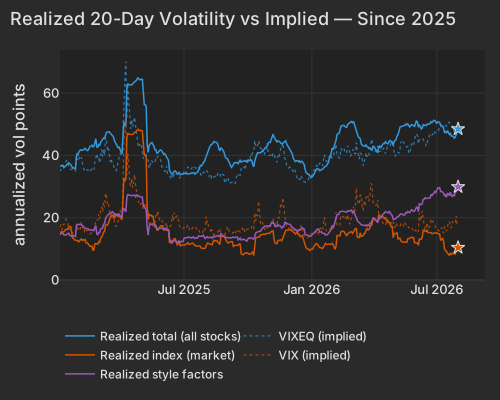
| Series | Today Vol Pts | Prev Close Vol Pts |
|---|---|---|
| total | 48.50 | 48.92 |
| market | 10.40 | 10.37 |
| style | 29.90 | 30.93 |
The Dallas Fed Manufacturing Survey, released at 10:30 AM ET, showed the general business activity index at 1.3 in July against 0.0 in June and an estimate of -1.0, with production up six points to 10.1 and new orders at 6.4 — a mild expansion print that fits the six-basis-point curve shift better than it fits anything in equities today. The next scheduled test of the memory-cost story that split Apple from Amazon is Nvidia's report on August 26CNBC.
Variance decomposition: live intraday — 20260731 session, bracketed against its trailing-year range. Factor returns are trailing through last close. Total cross-sectional dispersion: 74%ile of the past year.
Variance mix — % of total, today vs 1d ago vs 1-yr avg
market 26%ile style 24%ile thematic 88%ile idiosyncratic 82%ile
Variance explained — today vs. factor's trailing-year range
Marker = the factor's share of today's total variance, placed in its own trailing-year range (box 25–75%ile, ticks 90%ile and max). Amber marker = unusually load-bearing today (≥90%ile of its own year). Factor name green = up today / red = down.
Correlation & dispersion — realized vs implied
Pairwise realized correlation (20d): 5.85% 0.9%ile since 2020 · 22%ile 3m
Top-500 pairwise: 6.60% 1.9%ile since 2020 · 14%ile 3m · implied (Cboe COR1M): 8.33 1.7%ile of its own history (gap -1.7pp)
Realized 20d vol (ann. pts): all stocks 48 vs VIXEQ 45 · index 10 vs VIX 17 · style factors 30 97.7%ile
20-day window (19 completed days + today); percentiles vs model history since 2020; '3m' tokens rank vs the trailing 63 trading days; definitions in Terms below. Implied prints (Cboe) are delayed ~15 min. as of 11:21 ET
Top 50 high-beta momentum names (eq-wt, since-2020 rank): +2.2% 79%ile · rest of market -0.6%
| Factor | Today | 1d | 5d | 20d | 60d |
|---|---|---|---|---|---|
| Style-Risk | |||||
| Residual Volatility | -0.15% z-0.3 | +0.78% | +0.92% | -0.96% | -2.14% |
| Beta | +0.25% z+0.2 | +4.23% | -0.62% | -6.18% | -3.24% |
| International | -0.07% z-0.2 | +0.38% | +0.69% | +1.62% | -0.59% |
| Style | |||||
| Size | +0.54% z+1.5 | +0.22% | +0.19% | +0.48% | +0.07% |
| Value | +0.33% z+1.4 | -0.29% | +0.16% | +1.09% | -0.61% |
| Leverage | -0.19% z-1.1 | -0.17% | -0.98% | -0.89% | -1.15% |
| Liquidity | -0.24% z-0.8 | +1.37% | -0.07% | -0.01% | -2.20% |
| Dividend Yield | +0.08% z+0.4 | +0.17% | -0.71% | +0.03% | -0.27% |
| Growth | -0.09% z-0.4 | -0.23% | +0.01% | +0.72% | +2.01% |
| Profitability | +0.03% z+0.2 | -0.15% | -0.04% | +0.34% | -0.49% |
| Style-Momentum | |||||
| Short-Term Momentum | -0.88% z-2.6 | -1.37% | -3.70% | -5.94% | -8.02% |
| Medium-Term Momentum | -0.23% z-0.8 | -0.16% | +1.27% | -1.30% | +1.93% |
| One-Day Momentum | -0.04% z-0.1 | -0.68% | +1.99% | -0.33% | +3.62% |
| Long-Term Momentum | +0.08% z+0.1 | +1.95% | -2.15% | -1.63% | -2.33% |
| Style-Positioning | |||||
| Short Interest | -0.31% z-1.8 | -0.74% | -0.08% | -0.74% | +1.17% |
| Hedge-Fund Ownership | -0.03% z-0.3 | -0.04% | +0.01% | +0.02% | -0.73% |
| Style-Flow | |||||
| Morning Activity | -0.24% z-1.9 | +0.26% | +0.43% | -0.02% | -0.71% |
| Short-Sale Activity | -0.05% z-0.4 | -0.13% | +0.05% | -0.18% | -0.31% |
| Thematic | |||||
| Gold | -0.85% z-2.6 | +0.03% | -1.06% | -0.26% | -3.11% |
| Bitcoin / Crypto | -0.45% z-1.5 | +0.65% | +0.49% | -0.14% | -0.97% |
| Semiconductors | +0.61% z+1.0 | +2.16% | -2.31% | -1.09% | -2.95% |
| Oil | +0.34% z+0.7 | +0.92% | +0.38% | +1.92% | -2.69% |
| China | +0.23% z+0.6 | -0.52% | +0.60% | +1.42% | -3.31% |
| Treasury (Duration) | -0.11% z-0.3 | -0.15% | -0.39% | +0.87% | +0.77% |
5/20/60d windows include today's session; 1d is the previous session.
Pairwise realized correlation. Index variance net of the weighted idiosyncratic diagonal, over the cross terms — the estimator used for implied-correlation indices. 20-day window unless noted; history since 2020.
Market variance share. The fraction of cross-sectional variance explained by the market factor — the attribution companion to pairwise correlation, not a substitute for it.
Factor z-score. Today's factor return divided by its daily-return standard deviation over ~1,600 trading days.
High-beta momentum cohort. US names above $2B market cap in the top quintile of both raw beta and 12-month momentum; membership frozen at each month's first business day. “Top 50” = the 50 strongest by combined rank.
Stock-specific (idiosyncratic) return. The part of a stock's move not explained by market, style, or thematic factors in our decomposition.
Data compiled by FactorPulse AI; edited and verified by Jeff Klein. For informational purposes only. Does not constitute financial advice, an investment recommendation, or an offer to buy or sell any securities. Always consult a qualified financial professional before making investment decisions.
For more on factor construction methodology, see www.factorpulse.com/glossary.