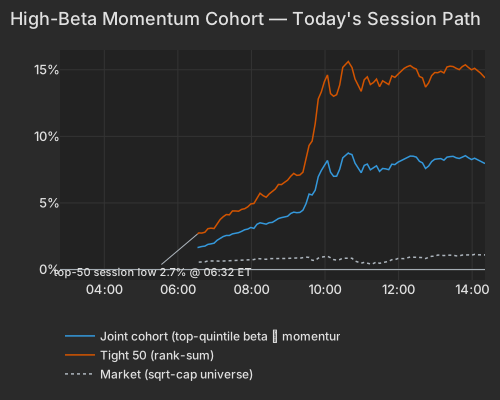
Situational Awareness was pushed into selling its whole book after July's semiconductor reversal, and Citadel absorbed it in a block tradeNYT. That closes a loop the positioning data opened weeks ago: as reported by Goldman Sachs' prime brokerage, the desk booked its largest five-day de-grossing on record this month, with Asia-focused fundamental long-short funds down 18.6% on average through July 28. Sequence the windows and the phase read follows. In yesterday's session the group still looked marked down rather than sold: volume ran below the tape's pace, members moved as one basket at the 88th percentile of their 60-day norm, and the easiest-to-sell names went first, the most liquid third of the ~190-name group -6.86% against -3.48% for the least liquid. Today the top 50 peaked at +15.62% at 10:38 and has held above +14% since, and the buying concentrated hard in the most crowded names — the top 50 ran 1.81× the broader group's move, well above its 1.14× norm. That group came in 28.2% below its high, so the recovery is one session old; the liquidation leg is what has stopped.
| Series | Ret Pct |
|---|---|
| joint | 7.96 |
| tight50 | 14.41 |
| market | 1.10 |
| rest | -0.81 |
Short Interest is -0.72% (z=-4.1), the 0.06th percentile of 1,651 sessions since 2020 and the most negative per-sigma reading since March 19, 2020. On a session when beaten-down high-beta names rose 14%, the most heavily shorted names lagged badly while the barely-shorted bucket ran +3.1% — the model's most persistent long-run effect working harder than on almost any day of the past six years. Read from a hedged book, that is massive short-side alpha: the shorts rose far less than their hedges even as absolute marks moved against them. With the crowded longs up 14% at the same time, both legs of the classic long/short book paid at once — likely a substantial recovery day for fundamental long/short funds after July's drawdowns.
Liquidity is +1.31% (z=+4.5), its highest per-sigma print since March 2021, with the top-turnover bucket +8.7%; at that extreme, turnover is an options-activity proxy, which points at call buying and the dealer hedging behind it in the most optionable names.
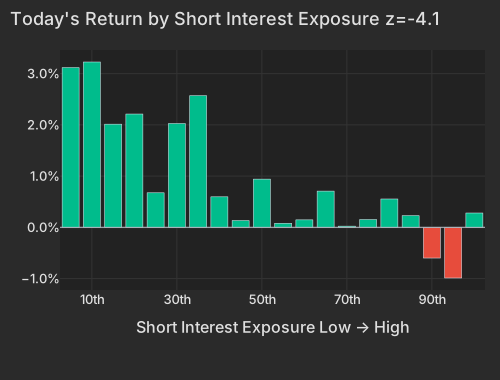
| Bucket | Avg Ret Pct |
|---|---|
| 1 | 3.12 |
| 2 | 3.23 |
| 3 | 2.01 |
| 4 | 2.21 |
| 5 | 0.67 |
| 6 | 2.03 |
| 7 | 2.57 |
| 8 | 0.60 |
| 9 | 0.13 |
| 10 | 0.94 |
| 11 | 0.08 |
| 12 | 0.15 |
| 13 | 0.71 |
| 14 | 0.02 |
| 15 | 0.15 |
| 16 | 0.55 |
| 17 | 0.23 |
| 18 | -0.60 |
| 19 | -0.99 |
| 20 | 0.28 |
Beta supplies the magnitude — +3.91% (z=+4.0), its strongest per-sigma reading since April 2025, explaining 34% of today's cross-sectional variance, with the highest-beta bucket +11.8% and the low-beta half quiet, against a -9.58% run in the factor over the prior twenty sessions. The ownership lens declines to name the buyer: hedge-fund-crowded names are +0.16% on a raw basis and -0.06% once style is stripped out, which attributes nothing. The characteristic tells you which trade is being bought, not who is buying it.
| Factor | Return | Z-Score | 5d Z | 20d Z | 63d Z | Category | Direction |
|---|---|---|---|---|---|---|---|
| Liquidity | +1.31% | z=+4.5 | -0.9 | -0.0 | -0.6 | Style | Highest-turnover names led |
| Short Interest | -0.72% | z=-4.1 | +1.1 | -0.2 | +1.1 | Style-Positioning | Most-shorted names lagged the un-shorted |
| Beta | +3.91% | z=+4.0 | -1.5 | -2.2 | -0.2 | Style-Risk | Most market-sensitive names led |
| Short-Term Momentum | -1.31% | z=-3.9 | -4.3 | -3.4 | -2.3 | Style-Momentum | Past week's losers outperformed its winners |
| Semiconductors | +2.12% | z=+3.5 | -3.2 | -1.2 | -0.5 | Thematic | Chip-exposed names led |
| Long-Term Momentum | +1.83% | z=+2.8 | -2.5 | -1.2 | 0.0 | Style-Momentum | 12-month winners led |
| One-Day Momentum | -0.79% | z=-2.7 | +2.6 | +0.1 | +1.1 | Style-Momentum | Yesterday's winners gave back |
| Hedge-Fund Ownership | -0.06% | -0.5 | -0.0 | +0.2 | -1.0 | Style-Positioning | Most-owned names slightly lagged |
Short-Term Momentum is -1.31% (z=-3.9), and none of it is new: z=-3.4 over twenty sessions, z=-2.3 over sixty, with the factor down -5.13% and -6.69% across those windows. Recent multi-day losers keep beating recent winners, and today's version of that is the high-beta rebound under another name — the factor's stock-level tilt runs -0.39 against the high-beta momentum group, so the two are one trade, not two independent signals. Long-Term Momentum at +1.83% (z=+2.8) has the same entanglement, its tilt correlating 0.54 with the same names. Style factors account for 51% of cross-sectional variance today against a 20% one-year average, with realized style volatility at 57.5 vol points, the 99.5th percentile since 2020, while the index leg sits at 13.3. The options market has the same shape: implied single-stock volatility (Cboe VIXEQ) at 46.35, the 96th percentile of its own history, against implied index volatility (VIX) at 17.95, the 52nd. The 20-day realized correlation gauge at 5.0% has been pinned near the floor of its since-2020 range for weeks, and today does nothing to it.
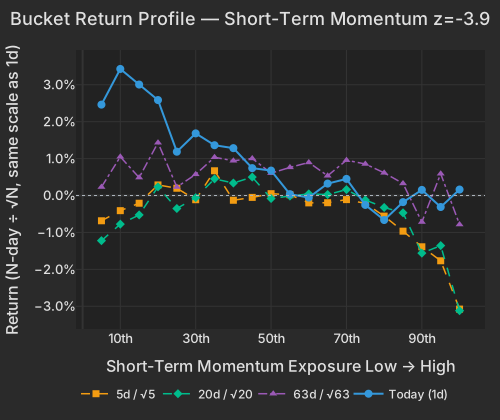
| Bucket | Ret 1D Pct | Ret 5D Norm Pct | Ret 20D Norm Pct | Ret 63D Norm Pct |
|---|---|---|---|---|
| 1 | 2.46 | -0.68 | -1.22 | 0.23 |
| 2 | 3.43 | -0.41 | -0.78 | 1.05 |
| 3 | 3.01 | -0.21 | -0.52 | 0.49 |
| 4 | 2.59 | 0.29 | 0.23 | 1.43 |
| 5 | 1.19 | 0.20 | -0.35 | 0.23 |
| 6 | 1.68 | -0.11 | -0.06 | 0.57 |
| 7 | 1.36 | 0.67 | 0.45 | 1.04 |
| 8 | 1.28 | -0.13 | 0.34 | 0.94 |
| 9 | 0.74 | -0.05 | 0.50 | 1.00 |
| 10 | 0.68 | 0.05 | -0.08 | 0.60 |
| 11 | 0.04 | 0.02 | -0.01 | 0.76 |
| 12 | -0.06 | -0.20 | 0.04 | 0.90 |
| 13 | 0.32 | -0.20 | 0.03 | 0.54 |
| 14 | 0.45 | -0.11 | 0.16 | 0.96 |
| 15 | -0.25 | -0.21 | -0.12 | 0.85 |
| 16 | -0.66 | -0.56 | -0.32 | 0.61 |
| 17 | -0.18 | -0.97 | -0.47 | 0.33 |
| 18 | 0.15 | -1.39 | -1.56 | -0.72 |
| 19 | -0.31 | -1.77 | -1.36 | 0.59 |
| 20 | 0.16 | -3.08 | -3.12 | -0.78 |
The long end went the other way. The 30-year Treasury yield is up 6.8 bps to 5.211% and the 20-year up 6.6 bps to 5.22%, while the 2-year is unchanged at 4.231%CNBC — a steepening that lands after JPMorgan pulled its first Fed hike forward to December following the July meetingEconomic Times and with second-quarter GDP bea.gov growth already deceleratingNYT. TLT is -0.10% today and -4.13% over twenty sessions; the discount rate underneath these names has not improved. The defensive complex is funding the move — staples, healthcare and real estate are all lower — and a softer dollar is helping at the margin, DXY -0.98% to 99.90CNBC. Korea is the cleanest expression: EWY +10.02% after Samsung and SK Hynix posted a combined 150 trillion won of quarterly operating profitBloomberg, days after regulators there curbed leveraged ETFs following a roughly 40% monthly decline in the KospiEconomic Times.
| ETF | Theme | Today | 1d Ago | 5d Ago | 20d Ago | 63d Ago |
|---|---|---|---|---|---|---|
| WGMI | crypto miners | +21.30% | -11.99% | -24.25% | -31.35% | -7.04% |
| DRAM | memory chips & storage | +14.31% | -6.11% | -22.36% | -39.27% | +20.14% |
| EWY | south korea | +10.02% | -4.78% | -15.38% | -28.57% | -6.58% |
| SMH | semiconductors | +6.30% | -4.79% | -14.09% | -23.12% | +2.65% |
| MTUM | momentum | +5.11% | -3.15% | -9.91% | -17.42% | +2.50% |
| GRID | AI power infrastructure | +5.10% | -2.89% | -7.18% | -12.64% | -9.65% |
| SPY | large cap | +1.49% | -1.54% | -2.40% | -2.32% | +2.50% |
| XLV | healthcare | -1.57% | -0.61% | +4.27% | +4.78% | +15.57% |
| XLP | consumer staples | -2.25% | +0.34% | +3.53% | +5.16% | +5.15% |
| VXX | volatility | -5.21% | +6.31% | +8.68% | +6.02% | -17.33% |
The single-name split is sharper than anything the index shows. MSFT +17.20% is almost entirely its own move, the largest in its trailing year, on Azure growth of 43% and annual cloud revenue past $100bnWSJ, while META -8.96% is equally stock-specific with capital spending at $31.1bn and free cash flow down to $784mCNBC. The memory names are a different mechanism: MU +18.18% and SNDK +23.66% are beta and style carry with almost nothing company-specific in them, whereas Lam Research +17.37% brings a genuine stock-specific component behind record quarterly revenue and an $8.1bn September guideMarketWatch. Off the AI axis, MarketAxess +29.32% on ICE's $5.7bn cash offerEconomic Times and Alnylam -29.35% on a lowered TTR revenue forecastCNBC are the largest stock-specific moves in the book; Teladoc -28.81% follows, after what CNBC reported Thursday as an $11.4bn goodwill impairment and a withdrawn full-year outlook.
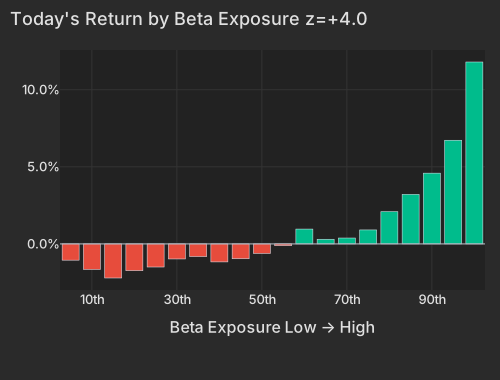
| Bucket | Avg Ret Pct |
|---|---|
| 1 | -1.05 |
| 2 | -1.65 |
| 3 | -2.21 |
| 4 | -1.74 |
| 5 | -1.50 |
| 6 | -0.98 |
| 7 | -0.82 |
| 8 | -1.17 |
| 9 | -0.96 |
| 10 | -0.62 |
| 11 | -0.11 |
| 12 | 0.96 |
| 13 | 0.30 |
| 14 | 0.38 |
| 15 | 0.91 |
| 16 | 2.09 |
| 17 | 3.21 |
| 18 | 4.59 |
| 19 | 6.72 |
| 20 | 11.80 |
Variance decomposition: live intraday — 20260730 session, bracketed against its trailing-year range. Factor returns are trailing through last close. Total cross-sectional dispersion: 100.0%ile of the past year.
Variance mix — % of total, today vs 1d ago vs 1-yr avg
market 44%ile style 98.4%ile thematic 4.0%ile idiosyncratic 6.8%ile
Variance explained — today vs. factor's trailing-year range
Marker = the factor's share of today's total variance, placed in its own trailing-year range (box 25–75%ile, ticks 90%ile and max). Amber marker = unusually load-bearing today (≥90%ile of its own year). Factor name green = up today / red = down.
Correlation & dispersion — realized vs implied
Pairwise realized correlation (20d): 5.00% 0.7%ile since 2020 · 19%ile 3m
Top-500 pairwise: 6.08% 1.2%ile since 2020 · 9.5%ile 3m · implied (Cboe COR1M): 8.36 1.7%ile of its own history (gap -2.3pp)
Realized 20d vol (ann. pts): all stocks 48 vs VIXEQ 46 · index 10 vs VIX 18 · style factors 30 97.9%ile
20-day window (19 completed days + today); percentiles vs model history since 2020; '3m' tokens rank vs the trailing 63 trading days; definitions in Terms below. Implied prints (Cboe) are delayed ~15 min. as of 14:21 ET
Top 50 high-beta momentum names (eq-wt, since-2020 rank): +14.4% 99.9%ile · rest of market -0.8%
| Factor | Today | 1d | 5d | 20d | 60d |
|---|---|---|---|---|---|
| Style-Risk | |||||
| Beta | +3.91% z+4.0 | -2.59% | -3.38% | -9.58% | -2.88% |
| Residual Volatility | +0.64% z+1.3 | +0.37% | +0.28% | -1.23% | -2.28% |
| International | +0.31% z+1.0 | +0.36% | +0.61% | +1.89% | -0.66% |
| Style | |||||
| Liquidity | +1.31% z+4.5 | -0.54% | -0.57% | -0.05% | -2.31% |
| Growth | -0.31% z-1.3 | +0.07% | +0.08% | +0.71% | +1.79% |
| Dividend Yield | +0.18% z+1.0 | -0.18% | -0.97% | -0.34% | -0.16% |
| Size | +0.36% z+0.9 | -0.02% | -0.18% | -0.01% | -0.47% |
| Value | -0.19% z-0.8 | -0.08% | +0.19% | +0.71% | -0.51% |
| Leverage | -0.13% z-0.7 | -0.19% | -0.84% | -0.78% | -0.87% |
| Profitability | -0.10% z-0.5 | +0.04% | +0.04% | +0.05% | -0.11% |
| Style-Momentum | |||||
| Short-Term Momentum | -1.31% z-3.9 | -0.18% | -3.23% | -5.13% | -6.69% |
| Long-Term Momentum | +1.83% z+2.8 | -0.40% | -3.73% | -3.41% | -1.45% |
| One-Day Momentum | -0.79% z-2.7 | +0.79% | +1.68% | +0.18% | +3.21% |
| Medium-Term Momentum | -0.12% z-0.4 | +0.46% | +2.22% | -1.03% | +2.69% |
| Style-Positioning | |||||
| Short Interest | -0.72% z-4.1 | +0.32% | +0.43% | -0.18% | +1.40% |
| Hedge-Fund Ownership | -0.06% z-0.5 | +0.13% | -0.00% | +0.09% | -0.98% |
| Style-Flow | |||||
| Morning Activity | +0.23% z+1.8 | +0.29% | +0.57% | +0.39% | -0.65% |
| Short-Sale Activity | -0.13% z-1.2 | -0.03% | +0.21% | +0.02% | +0.07% |
| Thematic | |||||
| Semiconductors | +2.12% z+3.5 | -0.92% | -4.34% | -3.33% | -2.44% |
| Bitcoin / Crypto | +0.58% z+1.9 | +0.23% | +0.59% | +0.49% | -0.89% |
| Oil | +0.75% z+1.5 | +0.54% | -0.91% | +0.55% | -3.31% |
| China | -0.47% z-1.1 | +0.40% | +0.55% | +1.38% | -3.71% |
| Treasury (Duration) | -0.18% z-0.5 | +0.14% | -0.13% | +1.30% | +0.53% |
| Gold | -0.01% z-0.0 | +0.03% | -0.05% | +1.64% | -2.72% |
5/20/60d windows include today's session; 1d is the previous session.
Market variance share. The fraction of cross-sectional variance explained by the market factor — the attribution companion to pairwise correlation, not a substitute for it.
Factor z-score. Today's factor return divided by its daily-return standard deviation over ~1,600 trading days.
High-beta momentum cohort. US names above $2B market cap in the top quintile of both raw beta and 12-month momentum; membership frozen at each month's first business day. “Top 50” = the 50 strongest by combined rank.
Stock-specific (idiosyncratic) return. The part of a stock's move not explained by market, style, or thematic factors in our decomposition.
VIXEQ / DSPX / COR1M. Cboe implied indices: single-stock volatility, dispersion, and 1-month implied correlation (top-50 S&P names). Quotes delayed ~15 minutes.
Data compiled by FactorPulse AI; edited and verified by Jeff Klein. For informational purposes only. Does not constitute financial advice, an investment recommendation, or an offer to buy or sell any securities. Always consult a qualified financial professional before making investment decisions.
For more on factor construction methodology, see www.factorpulse.com/glossary.