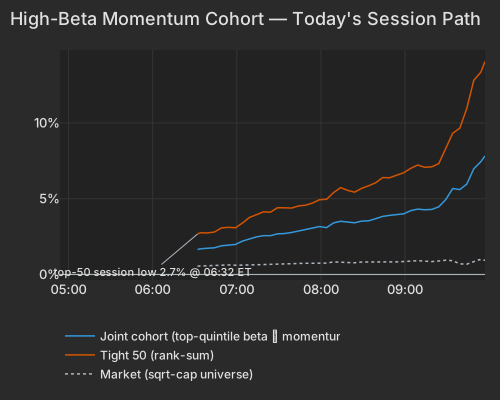
Sequence the evidence by window and the phase read writes itself. Goldman's prime-brokerage figures, as of July 28, describe a month of record liquidation in leveraged AI-hardware positions. Our own microstructure read on yesterday's session still looked like that: the group traded on light volume, its members moved as one basket at the 88th percentile of their 60-day norm, and the easiest-to-sell names went first, the highest-ADV third of the ~190-name group down -6.86% against -3.48% for the least liquid. Today the same names are the best-performing thing on the screen, and the buying is rank-concentrated in the extreme: the top 50 ran 1.79× the broader group's move, against a 1.14× norm — the more a name fit the high-beta momentum profile, the harder it ran. The group entered the session 28.2% below its high. One session at this magnitude does not repair that, but the liquidation leg of this episode has at minimum stalled.
| Series | Ret Pct |
|---|---|
| joint | 7.70 |
| tight50 | 13.81 |
| market | 0.94 |
| rest | -0.86 |
The factor tape says the same thing in cleaner terms. Beta is the day's dominant axis at +3.81% (z=+3.9), explaining 36% of cross-sectional variance and running at the 99.8th percentile of its own history since 2020; the highest-beta bucket is +10.8% and the effect is entirely in that right side. Semiconductors is +2.17% (z=+3.6) after -4.27% over the prior five sessions. Long-Term Momentum is +1.75% (z=+2.7) — and per the exposure overlap it is not an independent confirmation, since its stock-level tilt correlates 0.54 with the same group. Microsoft carried none of this: MSFT's +14.92% is almost entirely the stock's own move, its largest in a trailing year, on Azure growth of 43% and annual cloud revenue past $100bnWSJ. The factor complex did the work elsewhere — MU +13.37% is beta and style carry with a slightly negative stock-specific component, and Lam Research +21.11% arrives with an $8.1bn September-quarter revenue guide behind it.
| Factor | Return | Z-Score | 5d Z | 20d Z | 63d Z | Category | Direction |
|---|---|---|---|---|---|---|---|
| Beta | +3.81% | z=+3.9 | -1.6 | -2.2 | -0.2 | Style-Risk | Most market-sensitive names led |
| Semiconductors | +2.17% | z=+3.6 | -3.2 | -1.2 | -0.5 | Thematic | Chip-exposed names led |
| Long-Term Momentum | +1.75% | z=+2.7 | -2.6 | -1.2 | +0.0 | Style-Momentum | 12-month winners led |
| Liquidity | +1.04% | z=+3.6 | -1.3 | -0.3 | -0.7 | Style | Highest-turnover names led |
| Short-Term Momentum | -1.36% | z=-4.0 | -4.3 | -3.4 | -2.4 | Style-Momentum | Past week's losers outperformed its winners |
| Short Interest | -0.69% | z=-3.9 | +1.2 | -0.2 | +1.1 | Style-Positioning | Most-shorted names lagged the un-shorted |
| One-Day Momentum | -0.66% | z=-2.3 | +2.8 | +0.2 | +1.2 | Style-Momentum | Yesterday's winners gave back |
| Hedge-Fund Ownership | -0.14% | z=-1.2 | -0.3 | 0.0 | -1.1 | Style-Positioning | Most-owned names slightly lagged |
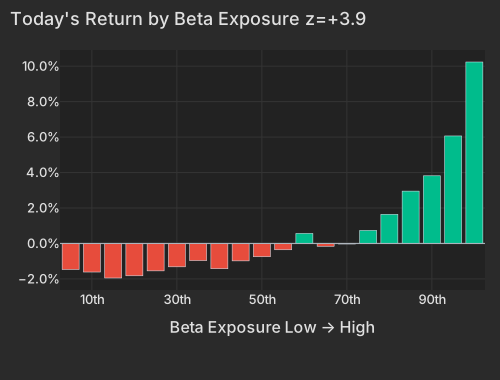
| Bucket | Avg Ret Pct |
|---|---|
| 1 | -1.47 |
| 2 | -1.61 |
| 3 | -1.95 |
| 4 | -1.83 |
| 5 | -1.55 |
| 6 | -1.32 |
| 7 | -0.97 |
| 8 | -1.43 |
| 9 | -0.98 |
| 10 | -0.75 |
| 11 | -0.36 |
| 12 | 0.56 |
| 13 | -0.16 |
| 14 | -0.03 |
| 15 | 0.73 |
| 16 | 1.64 |
| 17 | 2.95 |
| 18 | 3.81 |
| 19 | 6.06 |
| 20 | 10.23 |
Short Interest at z=-3.9 is the residual that matters. On a session where the most beaten-down high-beta names rise 13.8%, the reflex read is short covering; instead the most heavily shorted names underperformed the barely-shorted ones, with the un-shorted bucket +2.6%. That is the model's most persistent long-run effect doing its usual work, not a new signal — and it is corroborated by the composition of the group itself, which carried a below-average short-interest tilt (-0.85σ) into yesterday's close. Liquidity at z=+3.6, also right-tail driven with the top-turnover bucket +7.6%, points at the most heavily optioned names being bid, plausibly call buying and the dealer hedging that follows it. The ownership lens declines to name the buyer: Hedge-Fund Ownership is -0.14% (z=-1.2), so the trade is being bought back with the buyer unattributed.
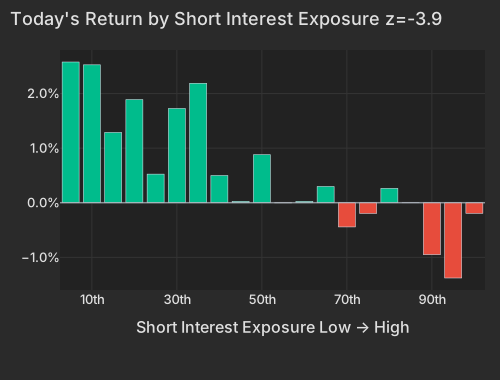
| Bucket | Avg Ret Pct |
|---|---|
| 1 | 2.58 |
| 2 | 2.53 |
| 3 | 1.29 |
| 4 | 1.89 |
| 5 | 0.52 |
| 6 | 1.73 |
| 7 | 2.19 |
| 8 | 0.50 |
| 9 | 0.03 |
| 10 | 0.88 |
| 11 | -0.00 |
| 12 | 0.02 |
| 13 | 0.30 |
| 14 | -0.44 |
| 15 | -0.19 |
| 16 | 0.26 |
| 17 | -0.00 |
| 18 | -0.95 |
| 19 | -1.38 |
| 20 | -0.19 |
Short-Term Momentum at z=-4.0 is the mechanical fingerprint of a bounce rather than fresh appetite: the past week's worst performers are up 2.2% on average today while the past week's best are down 0.6%. Read across horizons, the pattern is not new — the cross-bucket slope is -0.93 today against -0.26 over twenty days and -0.31 over sixty. Recent multi-day winners have been giving ground for weeks; today's session is the sharpest version of it, not the start.
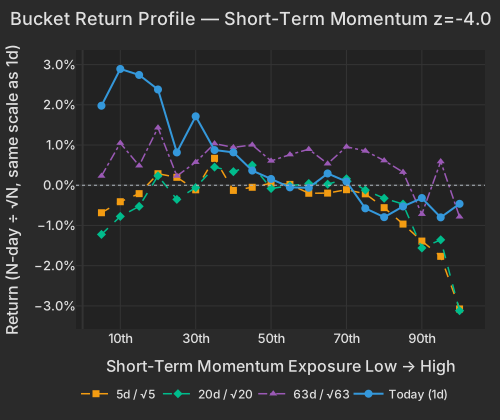
| Bucket | Ret 1D Pct | Ret 5D Norm Pct | Ret 20D Norm Pct | Ret 63D Norm Pct |
|---|---|---|---|---|
| 1 | 1.98 | -0.68 | -1.22 | 0.23 |
| 2 | 2.89 | -0.41 | -0.78 | 1.05 |
| 3 | 2.74 | -0.21 | -0.52 | 0.49 |
| 4 | 2.38 | 0.29 | 0.23 | 1.43 |
| 5 | 0.82 | 0.20 | -0.35 | 0.23 |
| 6 | 1.71 | -0.11 | -0.06 | 0.57 |
| 7 | 0.88 | 0.67 | 0.45 | 1.04 |
| 8 | 0.82 | -0.13 | 0.34 | 0.94 |
| 9 | 0.37 | -0.05 | 0.50 | 1.00 |
| 10 | 0.16 | 0.05 | -0.08 | 0.60 |
| 11 | -0.05 | 0.02 | -0.01 | 0.76 |
| 12 | -0.06 | -0.20 | 0.04 | 0.90 |
| 13 | 0.29 | -0.20 | 0.03 | 0.54 |
| 14 | 0.09 | -0.11 | 0.16 | 0.96 |
| 15 | -0.57 | -0.21 | -0.12 | 0.85 |
| 16 | -0.79 | -0.56 | -0.32 | 0.61 |
| 17 | -0.53 | -0.97 | -0.47 | 0.33 |
| 18 | -0.32 | -1.39 | -1.56 | -0.72 |
| 19 | -0.80 | -1.77 | -1.36 | 0.59 |
| 20 | -0.46 | -3.08 | -3.12 | -0.78 |
This is not a broad risk bid, and the funding side of it is visible. The rest of the market is -0.86%, real estate's median stock is -1.76% and consumer staples' -1.58%, with Altria -8.13% after its report this morning; XLP is -2.04% on 2.1× the typical ETF pace. Value did not participate at all — IWD is flat and XLF -0.26%. The rate picture that pressured long-duration equities all month is unchanged: the 30-year is up 5.7bp to 5.200% and the 20-year up 5.4bp to 5.208% while the 2-year is down 2.5bp to 4.211%CNBC, and J.P. Morgan has pulled its Fed hike call forward to DecemberEconomic Times. A weaker dollar helps at the margin, DXY -0.48% at 100.40CNBC.
The twenty-day damage also dwarfs one session: DRAM is +11.01% today against -39.27% over twenty days, SMH +6.03% against -23.12%, MTUM +4.72% against -17.42%. Korea, the epicentre of the drawdown, is the strongest single-country move with EWY +7.46%. Underneath, the index is still barely the story: the market leg explains 1.8% of cross-sectional variance this session against a 9.6% one-year average, style factors 53%, and realized correlation stays near its since-2020 lows with the 20-day blend at 4.86%. Implied index volatility (Cboe VIX) is down to 18.63 from 20.66 while implied single-stock volatility (VIXEQ) sits at 46.68 — the options market is paid for exactly the single-name churn this factor tape is producing.
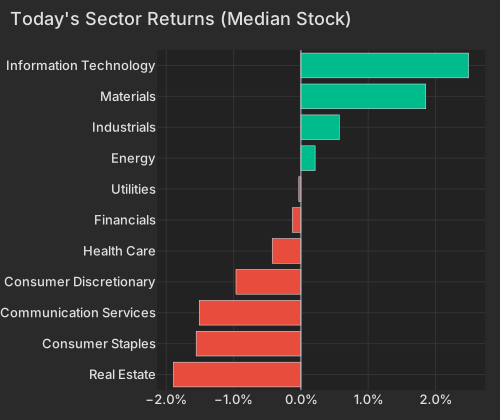
| Sector | Median Ret Pct |
|---|---|
| Real Estate | -1.89 |
| Consumer Staples | -1.56 |
| Communication Services | -1.51 |
| Consumer Discretionary | -0.96 |
| Health Care | -0.43 |
| Financials | -0.13 |
| Utilities | -0.03 |
| Energy | 0.21 |
| Industrials | 0.57 |
| Materials | 1.86 |
| Information Technology | 2.49 |
Instruments: SMH, DRAM, EWY, AIPO and MTUM for the bounce; XLP, XLV and XLRE for what funded it; QQQ +2.73% versus SPY +1.14% for how little of this reaches the index. Single names outside the factor story are carrying their own moves. MarketAxess is +29.82% — the largest stock-specific move in the universe — after Intercontinental Exchange agreed to acquire it for $6bn in cashthe SEC. EMCOR is +19.83% and Quanta Services +16.94% on data-centre and grid construction demand, and Arm is +8.14% after topping forecasts on AI data-centre royaltiesEconomic Times. On the other side: Meta -9.22% on capital spending of $31.1bn and its weakest free cash flow in yearsBloomberg, Alnylam -25.35% on a cut to its Amvuttra revenue guidanceCNBC, Capricor -52.77% after an FDA advisory committee voted 9-3 against its candidate's effectivenessBloomberg, and Carvana -10.17% on full-year guidance below the streetCNBC. Apple and Amazon report after the close, with AMZN +4.54% and AAPL -2.17% into it.
Variance decomposition: live intraday — 20260730 session, bracketed against its trailing-year range. Factor returns are trailing through last close. Total cross-sectional dispersion: 100.0%ile of the past year.
Variance mix — % of total, today vs 1d ago vs 1-yr avg
market 33%ile style 98.4%ile thematic 9.6%ile idiosyncratic 6.4%ile
Variance explained — today vs. factor's trailing-year range
Marker = the factor's share of today's total variance, placed in its own trailing-year range (box 25–75%ile, ticks 90%ile and max). Amber marker = unusually load-bearing today (≥90%ile of its own year). Factor name green = up today / red = down.
Correlation & dispersion — realized vs implied
Pairwise realized correlation (20d): 4.86% 0.7%ile since 2020 · 18%ile 3m
Top-500 pairwise: 5.74% 0.9%ile since 2020 · 4.8%ile 3m · implied (Cboe COR1M): 9.68 3.1%ile of its own history (gap -3.9pp)
Realized 20d vol (ann. pts): all stocks 48 vs VIXEQ 47 · index 10 vs VIX 19 · style factors 30 97.9%ile
20-day window (19 completed days + today); percentiles vs model history since 2020; '3m' tokens rank vs the trailing 63 trading days; definitions in Terms below. Implied prints (Cboe) are delayed ~15 min. as of 09:58 ET
Top 50 high-beta momentum names (eq-wt, since-2020 rank): +13.8% 99.9%ile · rest of market -0.9%
| Factor | Today | 1d | 5d | 20d | 60d |
|---|---|---|---|---|---|
| Style-Risk | |||||
| Beta | +3.82% z+3.9 | -2.59% | -3.46% | -9.67% | -2.96% |
| Residual Volatility | +0.59% z+1.2 | +0.37% | +0.23% | -1.28% | -2.33% |
| International | +0.27% z+0.9 | +0.36% | +0.57% | +1.85% | -0.70% |
| Style | |||||
| Liquidity | +1.06% z+3.6 | -0.54% | -0.83% | -0.31% | -2.57% |
| Dividend Yield | +0.19% z+1.1 | -0.18% | -0.96% | -0.33% | -0.15% |
| Profitability | +0.20% z+1.0 | +0.04% | +0.33% | +0.35% | +0.19% |
| Growth | -0.24% z-1.0 | +0.07% | +0.15% | +0.78% | +1.86% |
| Size | +0.34% z+0.9 | -0.02% | -0.19% | -0.03% | -0.49% |
| Value | -0.16% z-0.7 | -0.08% | +0.22% | +0.75% | -0.48% |
| Leverage | +0.01% z+0.0 | -0.19% | -0.70% | -0.64% | -0.73% |
| Style-Momentum | |||||
| Short-Term Momentum | -1.38% z-4.1 | -0.18% | -3.30% | -5.20% | -6.76% |
| Long-Term Momentum | +1.75% z+2.7 | -0.40% | -3.81% | -3.48% | -1.53% |
| One-Day Momentum | -0.66% z-2.2 | +0.79% | +1.81% | +0.31% | +3.34% |
| Medium-Term Momentum | -0.38% z-1.3 | +0.46% | +1.96% | -1.29% | +2.43% |
| Style-Positioning | |||||
| Short Interest | -0.69% z-3.9 | +0.32% | +0.46% | -0.14% | +1.43% |
| Hedge-Fund Ownership | -0.14% z-1.2 | +0.13% | -0.08% | +0.01% | -1.06% |
| Style-Flow | |||||
| Morning Activity | +0.17% z+1.3 | +0.29% | +0.51% | +0.33% | -0.71% |
| Short-Sale Activity | -0.11% z-1.0 | -0.03% | +0.23% | +0.04% | +0.09% |
| Thematic | |||||
| Semiconductors | +2.19% z+3.6 | -0.92% | -4.27% | -3.26% | -2.37% |
| Bitcoin / Crypto | +0.42% z+1.4 | +0.23% | +0.44% | +0.33% | -1.05% |
| Oil | +0.66% z+1.3 | +0.54% | -1.00% | +0.45% | -3.40% |
| China | -0.49% z-1.2 | +0.40% | +0.54% | +1.37% | -3.72% |
| Gold | -0.32% z-1.0 | +0.03% | -0.36% | +1.33% | -3.02% |
| Treasury (Duration) | -0.21% z-0.6 | +0.14% | -0.16% | +1.27% | +0.50% |
5/20/60d windows include today's session; 1d is the previous session.
Market variance share. The fraction of cross-sectional variance explained by the market factor — the attribution companion to pairwise correlation, not a substitute for it.
Factor z-score. Today's factor return divided by its daily-return standard deviation over ~1,600 trading days.
High-beta momentum cohort. US names above $2B market cap in the top quintile of both raw beta and 12-month momentum; membership frozen at each month's first business day. “Top 50” = the 50 strongest by combined rank.
Stock-specific (idiosyncratic) return. The part of a stock's move not explained by market, style, or thematic factors in our decomposition.
VIXEQ / DSPX / COR1M. Cboe implied indices: single-stock volatility, dispersion, and 1-month implied correlation (top-50 S&P names). Quotes delayed ~15 minutes.
Data compiled by FactorPulse AI; edited and verified by Jeff Klein. For informational purposes only. Does not constitute financial advice, an investment recommendation, or an offer to buy or sell any securities. Always consult a qualified financial professional before making investment decisions.
For more on factor construction methodology, see www.factorpulse.com/glossary.