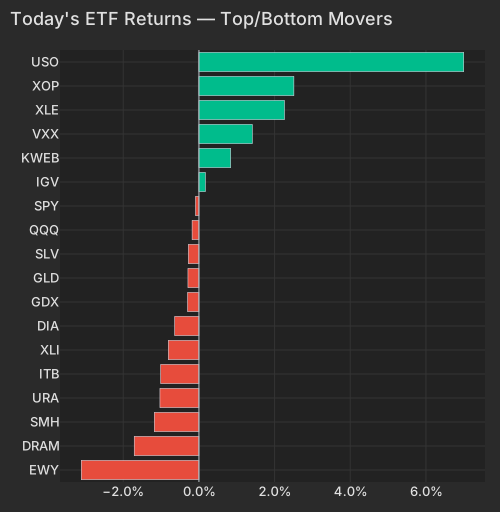
Iran fired multiple ballistic missiles at a U.S. military installation in Jordan on Tuesday; CENTCOM intercepted the barrage, and U.S. and Saudi aircraft struck Iran-aligned militia targets in Kirkuk and Nineveh in replyWSJ. Crude did the rest: Brent up 5.3% to $88.55 with reported attacks on three commercial tankers in the Strait of Hormuz behind the supply legNYT. Our Oil factor turned +0.47% (z=0.93) after five down sessions in five and -1.80% cumulatively over that stretch, and the most oil-exposed bucket returned +1.4%. USO is +6.28%, XOP +2.61%, XLE +2.21%. Energy leads the sector table with a +1.78% median stock — XOM +2.43%, CVX +2.24%, Equinor +5.99% — with Health Care the only other positive median at +0.24%.
| Factor | Return | Z-Score | 5d Z | 20d Z | 63d Z | Category | Direction |
|---|---|---|---|---|---|---|---|
| Oil | +0.47% | 0.93 | -1.61 | -0.12 | -0.51 | Thematic | Oil-exposed names outperformed |
| Beta | -0.51% | -0.52 | -2.6 | -3.1 | -0.44 | Style-Risk | High-beta names lagged again |
| Profitability | -0.22% | -1.1 | 0.19 | -0.57 | -0.40 | Style | More profitable names lagged |
| Short-Sale Activity | -0.06% | -0.53 | 0.42 | 0.11 | 0.02 | Style-Flow | Barely-short-sold names beat the heavily short-sold |
| Short Interest | -0.07% | -0.37 | 1.4 | 0.47 | 1.4 | Style-Positioning | Most-shorted names lagged the un-shorted |
| Size | -0.05% | -0.12 | -0.98 | -0.35 | -0.11 | Style | Flat |
| Hedge-Fund Ownership | -0.00% | -0.02 | -0.43 | 0.38 | -1.2 | Style-Positioning | Flat |
The names carrying the energy move are not carrying news. Venture Global +5.29%, Northern Oil & Gas +5.12%, Kosmos +5.09%, SM Energy +4.47% and PBF +3.35% are all factor-carried, with their own stock-specific components close to zero. Nothing around them corroborates a broader flight: the dollar is 101.46, up +0.04%CNBC, GLD is -0.14%, XAR +0.27% with ITA unchanged, VXX +1.27%, and long bonds are -0.18%. This is being bought as a barrel problem.
| ETF | Theme | Today | 1d Ago | 5d Ago | 20d Ago | 63d Ago |
|---|---|---|---|---|---|---|
| USO | oil | +6.28% | -3.42% | -6.49% | +12.52% | -10.56% |
| XLE | energy | +2.21% | -1.35% | -1.59% | +7.45% | +1.41% |
| VXX | volatility | +1.27% | -0.81% | +3.09% | -2.31% | -23.75% |
| USMV | minimum volatility | +0.51% | +1.04% | +2.08% | +2.50% | +5.33% |
| SPY | large cap | -0.06% | +0.24% | -0.99% | -0.02% | +3.59% |
| MTUM | momentum | -0.26% | -3.31% | -7.05% | -13.00% | +4.12% |
| SMH | semiconductors | -1.01% | -3.45% | -9.33% | -16.20% | +4.61% |
| DRAM | memory chips & storage | -1.38% | -8.89% | -18.83% | -33.60% | +23.85% |
| EWY | south korea | -2.86% | -6.05% | -12.41% | -23.32% | -3.37% |
| Sym | Theme | Ret Today Pct | Vol Pace |
|---|---|---|---|
| EWY | international | -3.11 | 1.71 |
| DRAM | technology | -1.71 | 1.38 |
| SMH | technology | -1.18 | 0.12 |
| URA | energy + cyclical | -1.03 | 0.13 |
| ITB | cyclical + rates | -1.01 | 0.01 |
| XLI | cyclical | -0.81 | 0.12 |
| DIA | size | -0.64 | 0.20 |
| GDX | currency | -0.30 | 0.10 |
| GLD | currency | -0.29 | 0.20 |
| SLV | currency | -0.28 | 0.50 |
| QQQ | growth | -0.18 | 0.34 |
| SPY | size | -0.09 | 0.11 |
| IGV | cyclical | 0.17 | 0.10 |
| KWEB | international | 0.84 | 0.05 |
| VXX | uncertainty | 1.41 | 0.09 |
| XLE | cyclical | 2.26 | 0.10 |
| XOP | energy + cyclical | 2.51 | 0.05 |
| USO | energy + cyclical | 7.00 | 1.48 |
Beta cleared the structural threshold weeks ago and has not let go: -13.45% over 20 sessions (z=-3.1), -5.75% over five (z=-2.6), and -0.51% again today. That is continuation, not a turn, and the ETF trail matches it — MTUM -13.00% and SMH -16.20% over 20 days. What has paused is the pace: the crowded high-beta momentum group is -0.12% pre-open against +0.08% for everything outside it.
Goldman Sachs and JPMorgan issued margin calls on July 29 with the Nasdaq 100 down 10% from its June peak; long-short equity funds fell 1.3% and multi-strategy funds 1.7% on July 28, and Goldman disclosed that 16% of its prime brokerage exposure was tied to AI memory names as of June 30. Our own microstructure evidence is one session old and points the same way: in Tuesday's session that group traded on light volume, below the tape's pace, its members moved together at the 87th percentile of their 60-day norm, and the easiest-to-sell names went first, the most liquid third down -5.81% against -3.25% for the least liquid. That ordering is what deleveraging looks like. This morning the direct positioning lenses are quiet — Hedge-Fund Ownership is flat on both the residualized (z=-0.02) and raw (z=-0.28) reads, and the most heavily shorted names again lagged the un-shorted ones at -0.07%. The desk numbers cover Monday and Tuesday, ours cover the last hour: on that sequence the episode reads as mid-course, with the 20-day Beta drawdown holding the damage and no new leg opening before the bell.
Over the blended 20-day window, style factors account for 27.5 volatility points of the cross-section (93.3rd percentile since 2020) while the index leg accounts for 8.2 (0.9th percentile), with Beta alone at 21.5% of total variance (94.7th percentile). Realized pairwise correlation of 3.95% remains pinned near its since-2020 lows at the 0.2nd percentile, with no fresh extreme set today; implied 1-month single-stock correlation (Cboe COR1M) at 7.76 sits in the lowest 1.2% of its 20-year history, and implied dispersion (Cboe DSPX) at 44.17 is 99.2nd percentile. The practical consequence is visible in this session: an oil shock of this size passes through exposures and leaves the index alone, and Korea's crash arrived without a Semiconductors factor move at all — that factor is +0.05% (z=0.09) today against -6.88% over 20 days. Anyone hedging chip risk with index products this month has been paying for protection the index never delivered.
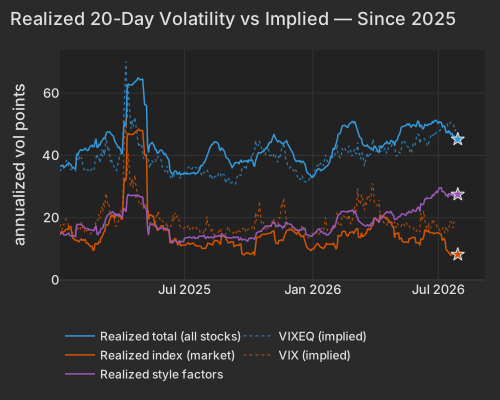
| Series | Today Vol Pts | Prev Close Vol Pts |
|---|---|---|
| total | 45.20 | 45.86 |
| market | 8.20 | 8.34 |
| style | 27.50 | 27.88 |
Vertiv fell -12.44% on revenue of $3.27bn against a $3.38bn consensus and organic order growth decelerating to 11%Bloomberg, and the drop is almost entirely its own move — the largest for the name in its trailing year. KLA is -9.06% despite record Q4 revenue, on FY27 guidance of $1.06–$1.26 versus a $1.13 consensusNYT. Parsons is -22.76% after adjusted EPS of $0.65 missed at $0.76 and EBITDA guidance was cut roughly 18%Bloomberg. The upside is equally idiosyncratic: GE HealthCare +9.64% on adjusted EPS of $1.13 against $1.04 and record organic orders up 11.1%the SEC, Amphenol +6.01% on $10.7bn of bookings, Manhattan Associates +11.80%. The biggest stock-specific move in the universe belongs to Verra Mobility at +27.82%, with nothing in today's coverage yet explaining it — the market is repricing that one on its own.
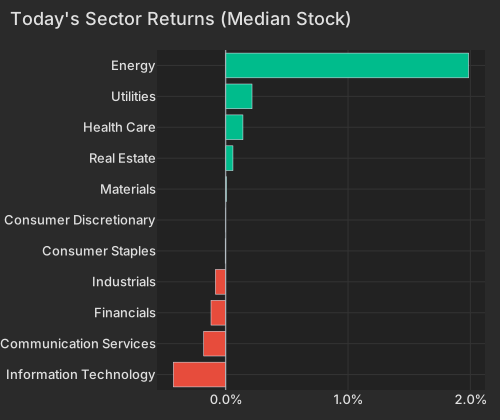
| Sector | Median Ret Pct |
|---|---|
| Information Technology | -0.43 |
| Communication Services | -0.18 |
| Financials | -0.12 |
| Industrials | -0.08 |
| Consumer Staples | -0.00 |
| Consumer Discretionary | 0.00 |
| Materials | 0.01 |
| Real Estate | 0.06 |
| Health Care | 0.14 |
| Utilities | 0.22 |
| Energy | 1.99 |
Seoul remains the loudest part of the chip story: the KOSPI fell 5.98% into a second consecutive circuit breaker after shedding nearly 11% the prior session, with SK hynix down 9.61% despite a sixfold profit surgeNYT. EWY is -2.86% today and -23.32% over 20 days; the Roundhill Memory ETF is -33.60% over the same window. The pass-through into U.S. semis is fading rather than accelerating — SMH is -1.01% after -3.45% yesterday.
Rates are doing the inflation arithmetic on the oil move at the front end: the 1-year is up 4.2bps to 4.124% and the 2-year up 3.7bps to 4.314%, against 1.0bp at the 30-year (5.106%)CNBC. Bloomberg's markets wrap put roughly a 35% probability on a hike from Chair Kevin Warsh at today's decisionNYT. Microsoft and Meta report after the close and neither has moved (+0.09% and +0.05%) — the hedges to watch are XLE and USO on the long side, and MTUM, SMH and DRAM for whether the 20-day Beta drawdown reopens after the bell.
Variance decomposition: live intraday — 20260729 session, bracketed against its trailing-year range. Factor returns are trailing through last close. Total cross-sectional dispersion: 8.0%ile of the past year.
Variance mix — % of total, today vs 1d ago vs 1-yr avg
market 8.0%ile style 23%ile thematic 30%ile idiosyncratic 93.2%ile
Variance explained — today vs. factor's trailing-year range
Marker = the factor's share of today's total variance, placed in its own trailing-year range (box 25–75%ile, ticks 90%ile and max). Amber marker = unusually load-bearing today (≥90%ile of its own year). Factor name green = up today / red = down.
Correlation & dispersion — realized vs implied
Pairwise realized correlation (20d): 3.95% 0.2%ile since 2020 · 4.8%ile 3m
Top-500 pairwise: 4.95% 0.1%ile since 2020 · 0.0%ile 3m · implied (Cboe COR1M): 7.76 1.2%ile of its own history (gap -2.8pp)
Realized 20d vol (ann. pts): all stocks 45 vs VIXEQ 48 · index 8 vs VIX 18 · style factors 28 93.3%ile
20-day window (19 completed days + today); percentiles vs model history since 2020; '3m' tokens rank vs the trailing 63 trading days; definitions in Terms below. Implied prints (Cboe) are delayed ~15 min. as of 08:21 ET
High-beta momentum cohort (eq-wt, since-2020 rank): -0.1% 43%ile · rest of market +0.1%
| Factor | Today | 1d | 5d | 20d | 60d |
|---|---|---|---|---|---|
| Style-Risk | |||||
| Beta | -0.51% z-0.5 | -2.38% | -5.75% | -13.45% | -4.74% |
| Residual Volatility | +0.07% z+0.1 | -0.40% | -0.78% | -1.92% | -2.56% |
| International | +0.03% z+0.1 | -0.06% | -0.15% | +1.09% | -1.44% |
| Style | |||||
| Profitability | -0.22% z-1.1 | -0.02% | +0.08% | -0.49% | -0.69% |
| Liquidity | +0.11% z+0.4 | -0.62% | -1.42% | -0.52% | -2.70% |
| Value | -0.04% z-0.2 | +0.21% | +0.45% | +0.66% | -0.68% |
| Size | -0.05% z-0.1 | -0.09% | -0.83% | -0.59% | -0.75% |
| Leverage | +0.02% z+0.1 | -0.08% | -0.30% | -0.97% | -0.70% |
| Dividend Yield | +0.01% z+0.1 | -0.37% | -1.03% | -0.52% | -0.28% |
| Growth | -0.01% z-0.0 | +0.19% | +0.64% | +1.37% | +2.41% |
| Style-Momentum | |||||
| Short-Term Momentum | -0.20% z-0.6 | -0.35% | -1.77% | -3.57% | -5.23% |
| Long-Term Momentum | +0.22% z+0.3 | -1.87% | -4.18% | -6.85% | -2.13% |
| One-Day Momentum | -0.09% z-0.3 | +1.23% | +1.71% | -0.29% | +3.57% |
| Medium-Term Momentum | +0.08% z+0.3 | +0.50% | +1.42% | -1.82% | +2.32% |
| Style-Positioning | |||||
| Short Interest | -0.07% z-0.4 | +0.49% | +0.56% | +0.37% | +1.92% |
| Hedge-Fund Ownership | -0.00% z-0.0 | -0.06% | -0.11% | +0.19% | -0.91% |
| Style-Flow | |||||
| Short-Sale Activity | -0.06% z-0.5 | +0.12% | +0.10% | +0.05% | +0.02% |
| Morning Activity | +0.05% z+0.4 | +0.11% | -0.08% | +0.10% | -1.01% |
| Thematic | |||||
| Oil | +0.47% z+0.9 | -0.87% | -1.80% | -0.27% | -3.08% |
| Treasury (Duration) | +0.16% z+0.5 | +0.10% | +0.31% | +1.16% | +0.84% |
| Bitcoin / Crypto | +0.14% z+0.5 | -0.18% | -0.39% | -0.32% | -1.17% |
| Gold | +0.09% z+0.3 | -0.22% | +0.05% | +2.10% | -2.69% |
| Semiconductors | +0.05% z+0.1 | -2.17% | -4.69% | -6.88% | -3.88% |
| China | -0.01% z-0.0 | +0.38% | +0.02% | +1.83% | -3.74% |
5/20/60d windows include today's session; 1d is the previous session.
Pairwise realized correlation. Index variance net of the weighted idiosyncratic diagonal, over the cross terms — the estimator used for implied-correlation indices. 20-day window unless noted; history since 2020.
Factor z-score. Today's factor return divided by its daily-return standard deviation over ~1,600 trading days.
High-beta momentum cohort. US names above $2B market cap in the top quintile of both raw beta and 12-month momentum; membership frozen at each month's first business day. “Top 50” = the 50 strongest by combined rank.
Dispersion (realized). Total cross-sectional volatility net of the market component; high dispersion is the flip side of low correlation.
Stock-specific (idiosyncratic) return. The part of a stock's move not explained by market, style, or thematic factors in our decomposition.
VIXEQ / DSPX / COR1M. Cboe implied indices: single-stock volatility, dispersion, and 1-month implied correlation (top-50 S&P names). Quotes delayed ~15 minutes.
Data compiled by FactorPulse AI; edited and verified by Jeff Klein. For informational purposes only. Does not constitute financial advice, an investment recommendation, or an offer to buy or sell any securities. Always consult a qualified financial professional before making investment decisions.
For more on factor construction methodology, see www.factorpulse.com/glossary.