Three officials voted to hike, Chair Kevin Warsh called the split a "good family fight" and formally retired forward guidance, and the 30-year Treasury yield reached its highest since 2007The Wall Street JournalBloomberg. The curve did the rest of the talking: the 20-year at 5.232% is up 7.8 bp and the 30-year at 5.212% up 6.9 bp against a 3-month bill that barely moved, with the 10-year at 4.687%CNBC. Iran fired five ballistic missiles at a US base in Jordan on Tuesday evening, Washington time — the early hours of Wednesday in Jordan — and crude held above $84 after a near-7% surgeThe Wall Street JournalBloomberg. Neither is a single-stock story: one raises the rate at which every long-duration cash flow is discounted, the other raises costs across much of the rest of the economy, and today the index absorbed both instead of netting them out through rotation.
| Factor | Return | Z-Score | 5d Z | 20d Z | 63d Z | Category | Direction |
|---|---|---|---|---|---|---|---|
| Beta | -3.00% | z=-3.1 | -3.8 | -3.6 | -0.8 | Style-Risk | Most market-sensitive names underperformed |
| Morning Activity | +0.35% | z=+2.7 | +0.7 | +0.7 | -0.7 | Style-Flow | Habitually morning-heavy names outperformed |
| One-Day Momentum | +0.69% | z=+2.4 | +3.8 | +0.4 | +1.5 | Style-Momentum | Yesterday's moves continued |
| Liquidity | -0.59% | z=-2.0 | -3.2 | -0.9 | -1.2 | Style | Highest-turnover names lagged the quietest |
| Short-Sale Activity | -0.17% | z=-1.5 | 0.0 | -0.1 | -0.1 | Style-Flow | Yesterday's short-sale flow paid off T+1 |
| Short Interest | +0.22% | z=+1.2 | +2.1 | +0.8 | +1.6 | Style-Positioning | Most heavily shorted names outperformed |
| Semiconductors | -0.81% | z=-1.4 | -4.1 | -2.9 | -0.7 | Thematic | Chip-exposed names lagged |
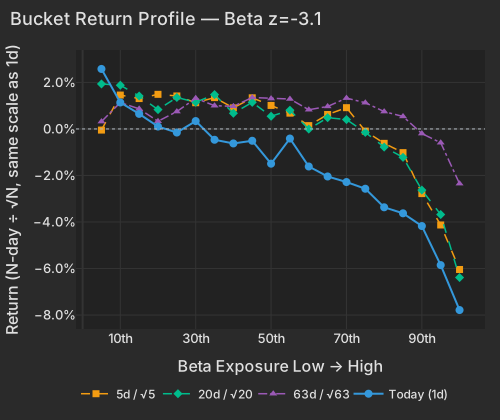
Beta alone explains 30% of today's cross-sectional variance, its 99.3rd percentile since 2020, and the sort is close to perfectly ordered — the most market-sensitive stocks down -7.8%, the least market-sensitive up +2.6% on the strength of energy exploration and refining. This is the fifth consecutive down session for the factor, -8.24% over five days and -15.94% over twenty. MTUM confirms it from the outside, -3.88% today and -13.00% over twenty sessions while still +4.12% over sixty-three — the give-back is a month old, not a quarter old. What is new today is not the selling; it is that the index stopped sitting it out.
| Bucket | Ret 1D Pct | Ret 5D Norm Pct | Ret 20D Norm Pct | Ret 63D Norm Pct |
|---|---|---|---|---|
| 1 | 2.58 | -0.05 | 1.93 | 0.32 |
| 2 | 1.14 | 1.46 | 1.88 | 1.13 |
| 3 | 0.65 | 1.31 | 1.42 | 0.86 |
| 4 | 0.10 | 1.49 | 0.83 | 0.33 |
| 5 | -0.15 | 1.42 | 1.35 | 0.75 |
| 6 | 0.34 | 1.13 | 1.15 | 1.32 |
| 7 | -0.47 | 1.35 | 1.48 | 1.00 |
| 8 | -0.62 | 0.91 | 0.67 | 0.97 |
| 9 | -0.51 | 1.34 | 1.14 | 1.35 |
| 10 | -1.49 | 1.01 | 0.55 | 1.30 |
| 11 | -0.41 | 0.68 | 0.80 | 1.29 |
| 12 | -1.61 | 0.14 | -0.01 | 0.83 |
| 13 | -2.04 | 0.62 | 0.48 | 0.97 |
| 14 | -2.28 | 0.91 | 0.40 | 1.33 |
| 15 | -2.57 | -0.09 | -0.15 | 1.13 |
| 16 | -3.37 | -0.62 | -0.78 | 0.75 |
| 17 | -3.63 | -1.02 | -1.22 | 0.54 |
| 18 | -4.17 | -2.78 | -2.63 | -0.20 |
| 19 | -5.85 | -4.13 | -3.68 | -0.59 |
| 20 | -7.79 | -6.04 | -6.39 | -2.35 |
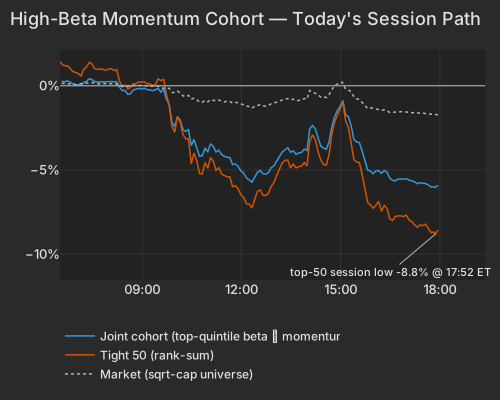
The damage is concentrated where high beta and strong momentum overlap — the crowded part of the market. The top 50 such stocks are down -8.63%, the ninth-worst session of 1,650 since 2020; the broader group of roughly 190 that share the profile fell -6.00%, against -0.57% for everything else. The top 50 moved 1.44× the broader group today versus a 1.14× norm: the more closely a stock fit the profile, the harder it fell. The biggest casualties — Super Micro -10.86%, Wolfspeed -10.77%, SanDisk -9.18%, Marvell -8.39% — moved for almost no company-specific reason.
| Series | Ret Pct |
|---|---|
| joint | -6.00 |
| tight50 | -8.63 |
| market | -1.71 |
| rest | -0.57 |
Goldman Sachs and JPMorgan began demanding additional collateral from hedge fund clients after Tuesday's session, following a 25% slide in the Philadelphia Semiconductor Index since late June.Financial Times · Jul 29 Tuesday left fundamental long-short funds down 1.3% and multi-strategy funds down 1.7% — the worst single day for both since the 2020 pandemic sessions — and the calls landed on a system carrying record leverage: US margin debt stands at an all-time high of $1.53 trillion, and Goldman disclosed that 16% of its prime-brokerage exposure was concentrated in AI memory-chip stocks as of June 30, after hedge fund leverage set records through the first half.Financial Times · Jul 29 Prime-brokerage data shows the other side of the same trade: funds have lifted US healthcare exposure to a five-year high while cutting AI and semiconductor positions.prime-brokerage flow data · Jul 28
The model saw the sequence from the inside. Yesterday the high-beta momentum cohort fell on aggregate volume a shade below the wider market's pace, but it moved as one basket — co-movement at the 88th percentile of its 60-day norm — and the easiest-to-sell stocks went first, -5.81% for the most liquid against -3.25% for the least. Today Liquidity at z=-2.0 extends that ordering: the highest-turnover stocks, the most heavily optioned part of the market and largely the same list, fell -6.7%. That order of operations — quiet in volume, ordered by what can be sold — is what collateral being raised looks like, as distinct from opinions changing.
Volatility is responding the way it usually does when leverage is cut under duress. The VIX rose 2.45 points to 20.66, VXX traded +7.31% on twice its typical ETF pace, and options dealers' gamma exposure has run below $1 billion per 1% move for a third straight session, so dealer hedging currently amplifies intraday swings rather than damping themMarketWatch. In past deleveraging episodes the chain has run: forced selling lifts realized volatility, higher volatility tightens the same risk limits that forced the selling, and if the pain runs long enough it ends in capitulation rather than rotation. Today's data establishes the first link — the five-day correlation gauge jumped to its 58.7th percentile of the past three months from 25.4th at yesterday's close — and nothing in the tape yet establishes the later ones.
The month-long rotation out of AI-adjacent risk now has a sentiment story attached, and it is coming from inside the buildout as well as outside it. A letter signed by 1,100 employees urging a pause in the AI buildout circulated this week — dissent from the people building it, not from its longstanding critics.press reports · Jul 2026 The Hugging Face incident has done something similar to the technical community: it made concrete quite how capable the newest 'Galaxy'-class models are as instruments of cyberattack, and a constituency that had been the buildout's most reliable advocate is now part of the risk conversation.press reports · Jul 2026
The external evidence is in the prices. Baird cut Caterpillar to Neutral and slashed its target to $900, counting 75 data-center projects worth roughly $130 billion delayed or blocked by state and local resistance in the first quarter aloneBarron's; Caterpillar fell -7.48% and industrials were the day's worst median sector at -3.46%. Vertiv fell -18.77% on a revenue miss the same day Microsoft disclosed more than $130 billion of new data-center leasesBloomberg — the demand is arriving, the equipment revenue is not yet. KLA reported a record quarter and finished -12.21% and $30 billion smallerNYT — the clearest evidence that in this part of the market results are not currently the binding constraint. Korea remains the epicentre of the memory-chip selloff, EWY -5.82% and -23.32% over twenty sessions after a second consecutive circuit breaker in SeoulNYT. That is the thesis at street level: the rate at which the buildout's cash flows are discounted is rising in the Treasury market, and the discount applied to its promises is rising everywhere else.
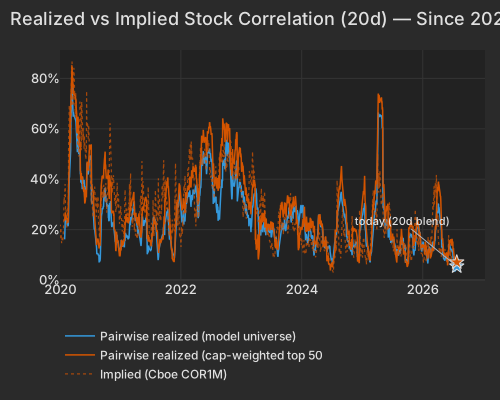
For a month the equity market has been having a violent argument with itself in near-total silence at the index level: over the trailing twenty sessions the market leg of variance is worth 9.9 vol points, the 5.7th percentile since 2020, while the style block runs 28.8 points at the 96.5th. That is why realized pairwise correlation sits at 5.44%, the 0.7th percentile since 2020, and the top-500 like-for-like at 7.04%. Today changed the fast clock, not the slow one. The five-day gauge is at 8.92%, its 58.7th percentile of the past three months against 25.4th at yesterday's close; index vol woke up with it, the VIX at 20.66 from 18.21, and Cboe's one-month implied single-stock correlation jumped to 11.97 from 7.76 — still inside the lowest 6.2% of its twenty-year history, and a premium to trailing realized. Twenty-day pairwise correlation carries several points of sampling noise, so one session does not reset the twenty-day picture; what it does is put the index on the same side of the trade as the factor for the first time this month.
| Series | Today Pct | Prev Close Pct |
|---|---|---|
| pairwise_model | 5.44 | 4.01 |
| pairwise_top500 | 7.04 | 5.02 |
| implied_cor1m |
Roughly half of today's cross-sectional variance is still stock-specific, and earnings were paid on merit: Huron Consulting +40.07% on a record quarter and raised guidance, the largest stock-specific move in its trailing year; Manhattan Associates +21.64%; Lithia Motors +18.70% on an earnings beat and a $500 million buyback increase while Carvana fell on soft 2026 guidanceCNBC; Garmin +16.90%. Short Interest at z=+1.2 fits that picture — the most heavily shorted stocks outperformed, running against one of the model's most persistent effects rather than establishing anything new.
The geopolitical trade was narrow. USO +7.69% and XOP +3.48% took the Iran headline and a 7.2 million-barrel crude drawThe Wall Street Journal, helped by a dollar index down -0.61% to 100.80CNBC; gold managed +0.96% and defense went the other way entirely, XAR -6.06% and ITA -4.03% after a week of gains.
| ETF | Theme | Today | 1d Ago | 5d Ago | 20d Ago | 63d Ago |
|---|---|---|---|---|---|---|
| USO | oil | +7.69% | -3.42% | -6.49% | +12.52% | -10.56% |
| XOP | oil E&P | +3.48% | -1.60% | -4.29% | +7.08% | -1.84% |
| GLD | gold | +0.96% | -1.40% | -1.45% | +0.21% | -14.08% |
| SPY | large cap | -1.79% | +0.24% | -0.99% | -0.02% | +3.59% |
| QQQ | large cap growth | -2.62% | -0.97% | -4.72% | -6.71% | +1.70% |
| MTUM | momentum | -3.88% | -3.31% | -7.05% | -13.00% | +4.12% |
| XAR | defense | -6.06% | -0.42% | +2.65% | -1.83% | +5.40% |
| EWY | south korea | -5.82% | -6.05% | -12.41% | -23.32% | -3.37% |
| SMH | semiconductors | -5.87% | -3.45% | -9.33% | -16.20% | +4.61% |
| DRAM | memory chips & storage | -8.49% | -8.89% | -18.83% | -33.60% | +23.85% |
Where to look tonight: the ETFs carrying the market-sensitivity trade are MTUM, SMH, DRAM, AIPO and EWY, with VXX — +7.31% on twice its typical volume — as the hedge against them; the beneficiaries are USO, XOP and XLE +1.81%. Among individual stocks, the after-the-close reports have already been graded — returns here run through roughly 6:00 PM ET, so they capture the first reaction. Meta closed the regular session down just -1.31%, then beat on second-quarter earnings while giving a forecast Bloomberg called lackluster, with AI capital spending the sticking pointBloomberg; it is marked -11.01% through 6 PM. Qualcomm, about -4.4% at the close, is marked -11.02%, and Arm, roughly -8% at the bell, -14.96% — including -6.46% in the final hour of the window — after both guided below the market's elevated expectations for AI-driven demandBloomberg. The late-session legs are reactions to the reports, not the broader selloff. One oddity worth flagging: MDY traded at 5.3× its typical volume for a move of only -1.98%, heavy mid-cap turnover with no matching price damage — worth watching alongside the margin-call reports, since collateral pressure tends to show up first as volume in the most liquid instruments.
The Fed Interest Rate Decision, released at 2:00 PM ET, held the federal funds rate at 3.50%–3.75% on a 9-3 vote — the first time since September 2016 that three policymakers have dissented in the same direction (September 2019 also saw three dissents, split between easier and tighter) — with Hammack, Kashkari and Logan preferring an immediate 25 bp hikeThe Wall Street Journal. At the 2:30 PM ET press conference Warsh reaffirmed a strict 2% target and signalled a permanent end to telegraphed guidance, and long-end yields extended their rise through the hourAP News.
Variance decomposition: live intraday — 20260729 session, bracketed against its trailing-year range. Factor returns are trailing through last close. Total cross-sectional dispersion: 98.4%ile of the past year.
Variance mix — % of total, today vs 1d ago vs 1-yr avg
market 77%ile style 91.2%ile thematic 2.8%ile idiosyncratic 15%ile
Variance explained — today vs. factor's trailing-year range
Marker = the factor's share of today's total variance, placed in its own trailing-year range (box 25–75%ile, ticks 90%ile and max). Amber marker = unusually load-bearing today (≥90%ile of its own year). Factor name green = up today / red = down.
Correlation & dispersion — realized vs implied
Pairwise realized correlation (20d): 5.44% 0.7%ile since 2020 · 19%ile 3m
Top-500 pairwise: 7.04% 2.5%ile since 2020 · 18%ile 3m · implied (Cboe COR1M): 11.97 6.2%ile of its own history (gap -4.9pp)
5-day gauge: 8.92% — 59%ile of the past 3 months (lifting off the record lows)
Realized 20d vol (ann. pts): all stocks 47 vs VIXEQ 48 · index 10 vs VIX 21 · style factors 29 96.5%ile
20-day window (19 completed days + today); percentiles vs model history since 2020; '3m' tokens rank vs the trailing 63 trading days; definitions in Terms below. Implied prints (Cboe) are delayed ~15 min. as of 17:58 ET
Top 50 high-beta momentum names (eq-wt, since-2020 rank): -8.6% 0.5%ile worst since 2026-07-02 · rest of market -0.6%
| Factor | Today | 1d | 5d | 20d | 60d |
|---|---|---|---|---|---|
| Style-Risk | |||||
| Beta | -3.00% z-3.1 | -2.38% | -8.24% | -15.94% | -7.23% |
| International | +0.35% z+1.1 | -0.06% | +0.16% | +1.41% | -1.12% |
| Residual Volatility | +0.06% z+0.1 | -0.40% | -0.79% | -1.94% | -2.57% |
| Style | |||||
| Liquidity | -0.59% z-2.0 | -0.62% | -2.11% | -1.22% | -3.39% |
| Leverage | -0.23% z-1.3 | -0.08% | -0.55% | -1.22% | -0.95% |
| Dividend Yield | -0.18% z-1.0 | -0.37% | -1.22% | -0.71% | -0.47% |
| Value | -0.21% z-0.8 | +0.21% | +0.28% | +0.49% | -0.85% |
| Profitability | +0.12% z+0.6 | -0.02% | +0.42% | -0.15% | -0.35% |
| Size | -0.15% z-0.4 | -0.09% | -0.94% | -0.69% | -0.86% |
| Growth | -0.03% z-0.1 | +0.19% | +0.62% | +1.35% | +2.39% |
| Style-Momentum | |||||
| One-Day Momentum | +0.69% z+2.4 | +1.23% | +2.48% | +0.49% | +4.35% |
| Medium-Term Momentum | +0.41% z+1.4 | +0.50% | +1.75% | -1.50% | +2.65% |
| Long-Term Momentum | -0.34% z-0.5 | -1.87% | -4.73% | -7.41% | -2.68% |
| Short-Term Momentum | -0.16% z-0.5 | -0.35% | -1.73% | -3.52% | -5.19% |
| Style-Positioning | |||||
| Short Interest | +0.21% z+1.2 | +0.49% | +0.84% | +0.65% | +2.20% |
| Hedge-Fund Ownership | +0.08% z+0.7 | -0.06% | -0.03% | +0.26% | -0.84% |
| Style-Flow | |||||
| Morning Activity | +0.35% z+2.7 | +0.11% | +0.22% | +0.40% | -0.71% |
| Short-Sale Activity | -0.17% z-1.5 | +0.12% | -0.01% | -0.06% | -0.09% |
| Thematic | |||||
| Semiconductors | -0.81% z-1.4 | -2.17% | -5.56% | -7.74% | -4.75% |
| China | +0.45% z+1.1 | +0.38% | +0.47% | +2.29% | -3.29% |
| Oil | +0.49% z+1.0 | -0.87% | -1.78% | -0.24% | -3.06% |
| Treasury (Duration) | +0.26% z+0.8 | +0.10% | +0.41% | +1.26% | +0.94% |
| Bitcoin / Crypto | +0.19% z+0.6 | -0.18% | -0.34% | -0.27% | -1.12% |
| Gold | +0.19% z+0.6 | -0.22% | +0.15% | +2.20% | -2.59% |
5/20/60d windows include today's session; 1d is the previous session.
Pairwise realized correlation. Index variance net of the weighted idiosyncratic diagonal, over the cross terms — the estimator used for implied-correlation indices. 20-day window unless noted; history since 2020.
Market variance share. The fraction of cross-sectional variance explained by the market factor — the attribution companion to pairwise correlation, not a substitute for it.
Factor z-score. Today's factor return divided by its daily-return standard deviation over ~1,600 trading days.
High-beta momentum cohort. US names above $2B market cap in the top quintile of both raw beta and 12-month momentum; membership frozen at each month's first business day. “Top 50” = the 50 strongest by combined rank.
Dispersion (realized). Total cross-sectional volatility net of the market component; high dispersion is the flip side of low correlation.
Stock-specific (idiosyncratic) return. The part of a stock's move not explained by market, style, or thematic factors in our decomposition.
VIXEQ / DSPX / COR1M. Cboe implied indices: single-stock volatility, dispersion, and 1-month implied correlation (top-50 S&P names). Quotes delayed ~15 minutes.
Data compiled by FactorPulse AI; edited and verified by Jeff Klein. For informational purposes only. Does not constitute financial advice, an investment recommendation, or an offer to buy or sell any securities. Always consult a qualified financial professional before making investment decisions.
For more on factor construction methodology, see www.factorpulse.com/glossary.