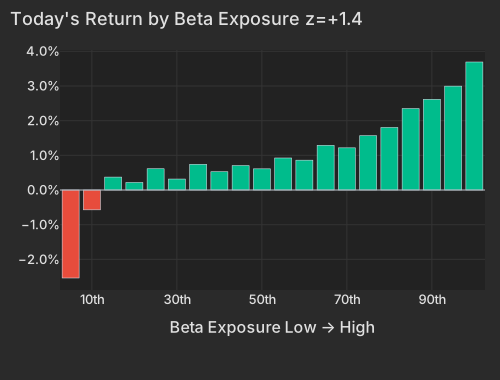
The pause in the two-week US–Iran exchange was agreed over the weekend of July 25–26NYT, and crude gave back the war move in one gap — Brent more than 9% lower to below $88, with a Kazakh export terminal also back in operationBloomberg. UK two-year gilt yields fell six basis points to a one-week low on the same impulseEconomic Times. In our model the transmission is unusually clean: Beta's return per unit of exposure is in the top 4% of sessions since 2020, and no other factor is close to it on either return or variance share.
| Factor | Return | Z-Score | 5d Z | 20d Z | 63d Z | Category | Direction |
|---|---|---|---|---|---|---|---|
| Beta | +1.40% | z=+1.4 | 0.48 | -1.4 | -0.11 | Style-Risk | Most market-sensitive names outperformed |
| Treasury (Duration) | -0.42% | z=-1.2 | 1.09 | 0.32 | -0.07 | Thematic | Duration-exposed names lagged |
| Oil | -0.32% | -0.63 | -0.75 | 0.58 | -0.32 | Thematic | Oil-exposed names lagged |
| International | +0.15% | 0.48 | 0.43 | 0.92 | -0.62 | Style-Risk | US-listed international names led US-headquartered |
| Residual Volatility | +0.20% | 0.39 | -0.84 | -0.20 | -0.38 | Style-Risk | Higher-volatility names outperformed |
| Short-Sale Activity | +0.05% | 0.42 | -0.38 | 0.21 | -0.18 | Style-Flow | Yesterday's most short-sold names outperformed the barely-shorted |
| Hedge-Fund Ownership | -0.06% | -0.56 | -1.8 | 0.18 | -1.1 | Style-Positioning | Most hedge-fund-crowded names lagged |
| Short Interest | -0.00% | -0.02 | -1.6 | -0.12 | 0.88 | Style-Positioning | Flat |
The names on the high side are being carried, not chosen. Wolfspeed (WOLF) +4.83%, Ouster (OUST) +4.57%, Critical Metals (CRML) +4.30% and Aeva (AEVA) +4.00% all show a slightly negative stock-specific component — the beta complex is the entire move. The same axis runs the other way through crude: Venture Global (VG) -5.90%, Kosmos Energy (KOS) -7.79%, SM Energy (SM) -5.00%, with Equinor (EQNR) -4.49% and Marathon Petroleum (MPC) -4.14% the large-cap version. It isn't a pure growth bid, either: gold miners sit in the same high-beta bucket, GDX +2.10%, with spot gold above $4,100NYT and the dollar index at 101.30, down -0.17%CNBC.
| Bucket | Avg Ret Pct |
|---|---|
| 1 | -2.54 |
| 2 | -0.57 |
| 3 | 0.37 |
| 4 | 0.22 |
| 5 | 0.61 |
| 6 | 0.32 |
| 7 | 0.74 |
| 8 | 0.53 |
| 9 | 0.70 |
| 10 | 0.61 |
| 11 | 0.92 |
| 12 | 0.86 |
| 13 | 1.29 |
| 14 | 1.22 |
| 15 | 1.57 |
| 16 | 1.80 |
| 17 | 2.35 |
| 18 | 2.62 |
| 19 | 3.00 |
| 20 | 3.69 |
The ETF board keeps the size of this in proportion. Memory chips and Korea lead — DRAM +4.55%, EWY +3.17%, helped by CXMT's 535% Shanghai debut, which Nomura argues has further to run on share gainsBloomberg — but DRAM is still -30.81% over twenty sessions and SMH -11.88%. Beta itself is -6.22% over the same window. Today recovers a corner of that.
| ETF | Theme | Today | 1d Ago | 5d Ago | 20d Ago | 63d Ago |
|---|---|---|---|---|---|---|
| DRAM | memory chips & storage | +4.55% | -8.75% | +0.91% | -30.81% | +46.31% |
| EWY | south korea | +3.17% | -6.27% | +0.26% | -20.51% | +8.21% |
| SMH | semiconductors | +2.23% | -3.27% | +0.84% | -11.88% | +16.47% |
| GDX | gold miners | +2.10% | +0.28% | +5.48% | -0.58% | -18.40% |
| MTUM | momentum | +1.73% | -2.42% | +1.42% | -9.70% | +11.06% |
| QQQ | large cap growth | +1.54% | -1.12% | -1.60% | -4.49% | +5.04% |
| TLT | long-term bonds | +0.70% | +0.10% | -1.50% | -4.69% | -3.81% |
| XLE | energy | -2.70% | +0.40% | +3.36% | +10.22% | +4.63% |
| XOP | oil E&P | -3.11% | -0.92% | +2.27% | +12.48% | +2.65% |
| USO | oil | -7.18% | -2.01% | +10.27% | +25.05% | +1.46% |
For a month stocks have refused to move together: the 20-day realized pairwise correlation is 5.58%, the 0.6th percentile since 2020, and the like-for-like large-cap series is 8.26%, the 4.0th percentile. Today the 5-day gauge printed 11.40% — the 68.3%ile of the trailing 63 sessions, up from the 41.3%ile at Friday's close. The pull is running through the style block rather than the index: style factors are 51.2% of session-so-far variance against a one-year average near 20%, with Beta alone at 48.4%, while implied index volatility (Cboe VIX) is lower at 17.59. One macro headline, one factor, everything else along for the ride.
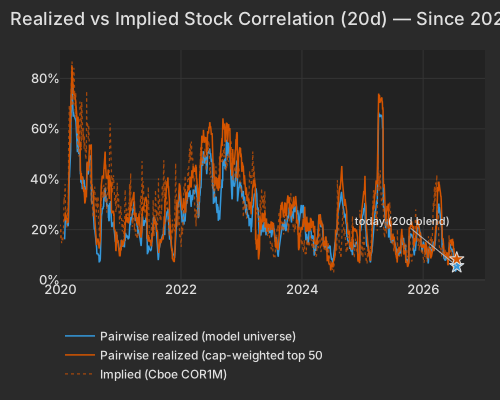
| Series | Today Pct | Prev Close Pct |
|---|---|---|
| pairwise_model | 5.58 | 4.07 |
| pairwise_top500 | 8.26 | 6.57 |
| implied_cor1m |
The options market is not paying for any of this. Implied dispersion (Cboe DSPX) is 44.09, the 99.2%ile of its own history, and implied 1-month single-stock correlation (Cboe COR1M) is 7.73, inside the lowest 1.1% of its 20-year history. Forward pricing still assumes single stocks go their own way; the 5-day realized gauge says today they did not. That gap is where a dispersion book gets hurt if the pause holds into the Fed.
Lower yields are not the channel here. The 10-year is at 4.639%, down four basis points, with the curve two to four basis points lower across every tenorCNBC, and yet Treasury (Duration) is -0.42% (z=-1.2): the least duration-exposed names, AI and semiconductor names plus China ADRs, are the bucket up +2.6%. Rate relief arrived and the market spent it on market sensitivity instead of duration.
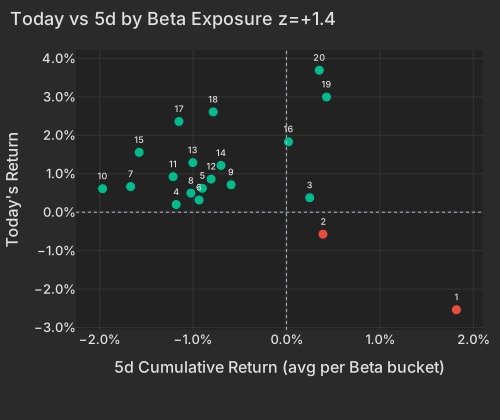
| Bucket | Ret 5D Pct | Today Ret Pct |
|---|---|---|
| 1 | 1.82 | -2.54 |
| 2 | 0.39 | -0.57 |
| 3 | 0.25 | 0.38 |
| 4 | -1.18 | 0.20 |
| 5 | -0.90 | 0.62 |
| 6 | -0.94 | 0.32 |
| 7 | -1.67 | 0.67 |
| 8 | -1.02 | 0.50 |
| 9 | -0.59 | 0.71 |
| 10 | -1.97 | 0.61 |
| 11 | -1.21 | 0.92 |
| 12 | -0.81 | 0.86 |
| 13 | -1.00 | 1.29 |
| 14 | -0.70 | 1.22 |
| 15 | -1.58 | 1.56 |
| 16 | 0.02 | 1.83 |
| 17 | -1.15 | 2.36 |
| 18 | -0.78 | 2.61 |
| 19 | 0.43 | 3.00 |
| 20 | 0.35 | 3.69 |
The top 50 high-beta momentum names are up +4.06%, a 93.6%ile session since 2020, against +0.37% for everything else; the broader ~190-name group is up +2.99% and, as of Friday's close, still roughly 20% below its high. Beta and that group are the same trade — the factor's exposures correlate about 0.5 with membership — so today's beta print is the group's bounce, not an independent confirmation of it. The buying is spread across the group in its usual proportion. In Friday's session the selling had a different shape: members moved as one basket, at the 85th percentile of their 60-day norm, on volume below the tape's pace, with the most liquid third of the top 50 down -8.42% against -7.63% for the least liquid. Hedge-Fund Ownership is -0.06% (z=-0.6) with the raw spread +0.04% — the most hedge-fund-crowded names are participating in the bounce, not leading it, and no positioning lens in the model names the buyer.
Liberty Broadband (LBRDK) is down -10.76%, essentially all of it the stock's own move, after Charter's Q2 subscriber losses and revenue missBloomberg. SAP is +5.22% with 3.8 points of that stock-specific, its largest such move in roughly a year, and Fortis (FTS) +8.00% is the biggest stock-specific print in the model — neither has a driver in today's coverage, and in pre-open trade both are marks awaiting liquidity. Seagate (STX) +3.43% ahead of Tuesday's fiscal Q4 is worth reading carefully: its own move is near zero, so that is the beta and momentum complex, not a storage-demand signal.
The Dallas Fed Manufacturing Survey is due at 10:30 AM ET, following June's flat 0.0 reading; consensus looks for another near-neutral print, with the production index (4.1 in June) the number to watch and Texas wage growth at 4.0% the risk on the cost side. The FOMC federalreserve.gov decision lands July 29, and Microsoft, Meta and Apple report this week — capital-expenditure guidance is what has driven the month's selling in exactly the high-beta names bouncing todayWSJ.
Variance decomposition: live intraday — 20260727 session, bracketed against its trailing-year range. Factor returns are trailing through last close. Total cross-sectional dispersion: 8.4%ile of the past year.
Variance mix — % of total, today vs 1d ago vs 1-yr avg
market 91.2%ile style 98.4%ile thematic 29%ile idiosyncratic 0.8%ile
Variance explained — today vs. factor's trailing-year range
Marker = the factor's share of today's total variance, placed in its own trailing-year range (box 25–75%ile, ticks 90%ile and max). Amber marker = unusually load-bearing today (≥90%ile of its own year). Factor name green = up today / red = down.
Correlation & dispersion — realized vs implied
Pairwise realized correlation (20d): 5.58% 0.6%ile since 2020 · 16%ile 3m
Top-500 pairwise: 8.26% 4.0%ile since 2020 · 18%ile 3m · implied (Cboe COR1M): 7.73 1.1%ile of its own history (gap +0.5pp)
5-day gauge: 11.40% — 68%ile of the past 3 months (lifting off the record lows)
Realized 20d vol (ann. pts): all stocks 45 vs VIXEQ 48 · index 9 vs VIX 18 · style factors 27 91.2%ile
20-day window (19 completed days + today); percentiles vs model history since 2020; '3m' tokens rank vs the trailing 63 trading days; definitions in Terms below. Implied prints (Cboe) are delayed ~15 min. as of 06:39 ET
Top 50 high-beta momentum names (eq-wt, since-2020 rank): +4.1% 93.6%ile · rest of market +0.4%
| Factor | Today | 1d | 5d | 20d | 60d |
|---|---|---|---|---|---|
| Style-Risk | |||||
| Beta | +1.40% z+1.4 | -2.18% | +1.05% | -6.22% | +1.35% |
| International | +0.15% z+0.5 | -0.08% | +0.30% | +1.27% | -1.30% |
| Residual Volatility | +0.20% z+0.4 | -0.65% | -0.95% | -0.46% | -1.78% |
| Style | |||||
| Size | +0.15% z+0.4 | +0.04% | -0.04% | +1.01% | -0.08% |
| Profitability | +0.07% z+0.4 | +0.06% | +0.43% | -0.12% | -0.63% |
| Liquidity | +0.06% z+0.2 | -0.69% | -0.06% | -0.51% | -1.43% |
| Value | -0.03% z-0.1 | +0.26% | +0.62% | -0.18% | -1.03% |
| Leverage | +0.02% z+0.1 | -0.08% | +0.76% | -0.83% | -0.07% |
| Dividend Yield | -0.01% z-0.1 | -0.19% | +0.28% | +0.00% | +0.72% |
| Growth | +0.00% z+0.0 | +0.05% | -0.00% | +1.40% | +2.18% |
| Style-Momentum | |||||
| Short-Term Momentum | -0.21% z-0.6 | -0.47% | -1.33% | -2.74% | -3.69% |
| One-Day Momentum | +0.10% z+0.3 | -0.25% | -0.01% | -1.29% | +0.84% |
| Long-Term Momentum | -0.16% z-0.2 | -1.38% | +1.19% | -2.01% | +2.35% |
| Medium-Term Momentum | -0.00% z-0.0 | +0.68% | -1.40% | -2.94% | +1.14% |
| Style-Positioning | |||||
| Hedge-Fund Ownership | -0.06% z-0.6 | -0.03% | -0.46% | +0.09% | -1.01% |
| Short Interest | -0.00% z-0.0 | +0.17% | -0.61% | -0.09% | +1.24% |
| Style-Flow | |||||
| Morning Activity | +0.09% z+0.6 | -0.06% | -0.09% | -0.01% | -1.11% |
| Short-Sale Activity | +0.05% z+0.4 | +0.11% | -0.10% | +0.11% | -0.06% |
| Thematic | |||||
| Treasury (Duration) | -0.42% z-1.2 | +0.18% | +0.84% | +0.49% | +0.83% |
| Oil | -0.32% z-0.6 | -0.78% | -0.84% | +1.29% | -2.51% |
| Gold | -0.07% z-0.2 | +0.20% | +0.91% | +1.46% | -2.28% |
| China | -0.08% z-0.2 | +0.14% | -0.28% | +0.82% | -4.78% |
| Semiconductors | -0.11% z-0.2 | -1.39% | +1.34% | -1.81% | +0.53% |
| Bitcoin / Crypto | +0.02% z+0.1 | -0.27% | -0.50% | -0.74% | -1.01% |
5/20/60d windows include today's session; 1d is the previous session.
Pairwise realized correlation. Index variance net of the weighted idiosyncratic diagonal, over the cross terms — the estimator used for implied-correlation indices. 20-day window unless noted; history since 2020.
Market variance share. The fraction of cross-sectional variance explained by the market factor — the attribution companion to pairwise correlation, not a substitute for it.
Factor z-score. Today's factor return divided by its daily-return standard deviation over ~1,600 trading days.
High-beta momentum cohort. US names above $2B market cap in the top quintile of both raw beta and 12-month momentum; membership frozen at each month's first business day. “Top 50” = the 50 strongest by combined rank.
Dispersion (realized). Total cross-sectional volatility net of the market component; high dispersion is the flip side of low correlation.
Stock-specific (idiosyncratic) return. The part of a stock's move not explained by market, style, or thematic factors in our decomposition.
VIXEQ / DSPX / COR1M. Cboe implied indices: single-stock volatility, dispersion, and 1-month implied correlation (top-50 S&P names). Quotes delayed ~15 minutes.
Data compiled by FactorPulse AI; edited and verified by Jeff Klein. For informational purposes only. Does not constitute financial advice, an investment recommendation, or an offer to buy or sell any securities. Always consult a qualified financial professional before making investment decisions.
For more on factor construction methodology, see www.factorpulse.com/glossary.