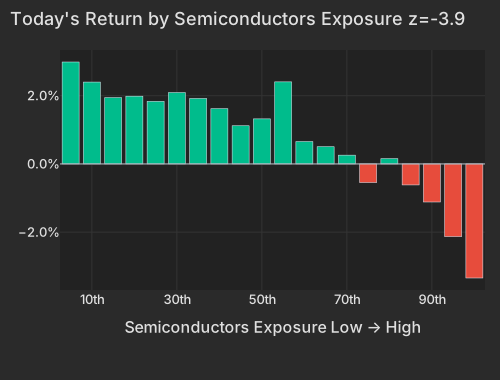
ChangXin Memory Technologies raised $9.8 billion and jumped 466% on debut, making it China's largest onshore-listed company by market value, as Bloomberg reported. Nomura's published view is that the shares can rally more than 1,200% from the IPO price as the company takes market share, as Bloomberg reported. The names on the other side of that share shift are the ones being sold: SanDisk -11.32% (roughly $21bn of market value), Silicon Motion -9.90%, Western Digital -6.91%, Seagate -5.96%, Micron -4.98%, Teradyne -6.12%. Korea went with them — EWY -2.11%, now -20.51% over 20 sessions.
| Bucket | Avg Ret Pct |
|---|---|
| 1 | 2.99 |
| 2 | 2.40 |
| 3 | 1.94 |
| 4 | 1.99 |
| 5 | 1.83 |
| 6 | 2.09 |
| 7 | 1.92 |
| 8 | 1.62 |
| 9 | 1.12 |
| 10 | 1.32 |
| 11 | 2.41 |
| 12 | 0.65 |
| 13 | 0.50 |
| 14 | 0.26 |
| 15 | -0.55 |
| 16 | 0.15 |
| 17 | -0.62 |
| 18 | -1.12 |
| 19 | -2.13 |
| 20 | -3.34 |
Almost none of those declines are the stocks' own. Western Digital's -6.91% splits into -9.33% of factor carry and +1.85% of company-specific move; Seagate, Micron, Teradyne and SanDisk read the same way, and in every case the factor doing the carrying is Long-Term Momentum. That factor is -2.04% today (z=-3.1) and accounting for 24.9% of cross-sectional variance — more than on any day in the past year. The signature is the recognised momentum-crash pattern rather than a verdict on the memory cycle: the worst 1-year laggards led the bounce, that bucket +2.46%, with SMCI, WOLF, SMR and NNE inside it. Short Interest +0.29% (z=+1.7) says the same thing from the short side, the most heavily shorted names beating the barely-shorted ones against the largest persistent drag in the model. Nvidia is the exception that proves the split — -4.11% and $204bn of market value, but that one is nearly all its own move.
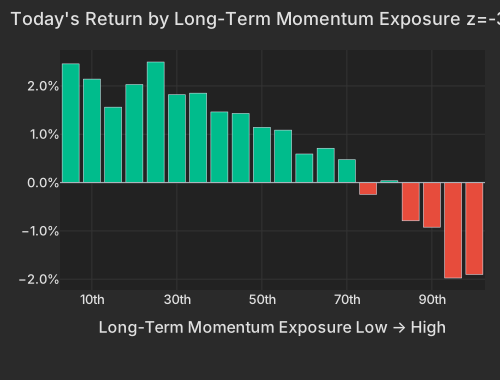
| Bucket | Avg Ret Pct |
|---|---|
| 1 | 2.46 |
| 2 | 2.14 |
| 3 | 1.56 |
| 4 | 2.03 |
| 5 | 2.50 |
| 6 | 1.82 |
| 7 | 1.85 |
| 8 | 1.46 |
| 9 | 1.43 |
| 10 | 1.14 |
| 11 | 1.09 |
| 12 | 0.59 |
| 13 | 0.71 |
| 14 | 0.47 |
| 15 | -0.24 |
| 16 | 0.04 |
| 17 | -0.79 |
| 18 | -0.92 |
| 19 | -1.97 |
| 20 | -1.90 |
| Factor | Return | Z-Score | 5d Z | 20d Z | 63d Z | Category | Direction |
|---|---|---|---|---|---|---|---|
| Semiconductors | -2.31% | -3.9 | -0.7 | -1.5 | -0.4 | Thematic | High-exposure names sold hard |
| Long-Term Momentum | -2.04% | -3.1 | -0.5 | -1.3 | 0.2 | Style-Momentum | 1-year winners lag laggards |
| Short-Term Momentum | -1.02% | -3.0 | -2.8 | -2.3 | -1.6 | Style-Momentum | Past week's winners gave back |
| Medium-Term Momentum | +0.87% | +3.0 | -0.8 | -1.6 | +1.1 | Style-Momentum | Past month's winners kept leading |
| One-Day Momentum | +0.63% | +2.2 | +0.8 | -0.6 | +0.7 | Style-Momentum | Yesterday's movers continued |
| Dividend Yield | -0.38% | -2.1 | -0.2 | -0.4 | 0.3 | Style | High payers lagged |
| Short Interest | +0.29% | +1.7 | -0.8 | 0.3 | +1.1 | Style-Positioning | Most-shorted names outperformed |
| Oil | -0.54% | -1.1 | -0.9 | +0.5 | -0.4 | Thematic | Oil-levered names modestly lower |
Style factors account for 50.0% of today's cross-sectional variance against a one-year average of 19.9%; the market leg is 4.0%. Medium-Term Momentum +0.87% (z=+3.0) looks like it argues the other way and does not — after this month's damage the beaten names have migrated into the one-month losers group, and their exposures now correlate -0.36 with the high-beta momentum cohort, so a positive medium-term print is the same selling reported under a different factor's name. Short-Term Momentum -1.02% (z=-3.0) has been leaning this way for weeks: -3.54% over 20 sessions and -4.50% over 60, with the exposure profile sloping the same direction at every horizon.
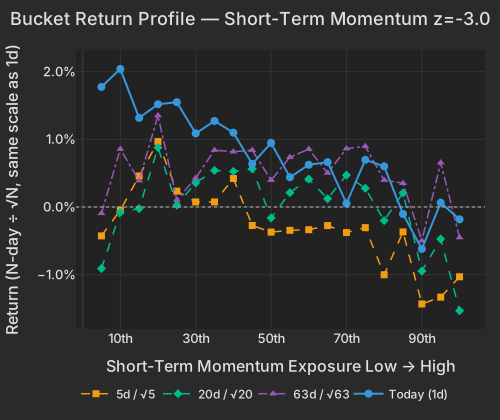
| Bucket | Ret 1D Pct | Ret 5D Norm Pct | Ret 20D Norm Pct | Ret 63D Norm Pct |
|---|---|---|---|---|
| 1 | 1.77 | -0.43 | -0.91 | -0.09 |
| 2 | 2.04 | -0.05 | -0.08 | 0.86 |
| 3 | 1.32 | 0.46 | -0.02 | 0.39 |
| 4 | 1.52 | 0.97 | 0.88 | 1.35 |
| 5 | 1.55 | 0.23 | 0.03 | 0.10 |
| 6 | 1.09 | 0.07 | 0.36 | 0.43 |
| 7 | 1.27 | 0.07 | 0.54 | 0.84 |
| 8 | 1.10 | 0.42 | 0.53 | 0.82 |
| 9 | 0.64 | -0.27 | 0.56 | 0.84 |
| 10 | 0.95 | -0.37 | -0.16 | 0.40 |
| 11 | 0.44 | -0.35 | 0.21 | 0.74 |
| 12 | 0.62 | -0.34 | 0.41 | 0.86 |
| 13 | 0.66 | -0.27 | 0.12 | 0.50 |
| 14 | 0.05 | -0.38 | 0.47 | 0.86 |
| 15 | 0.70 | -0.31 | 0.28 | 0.90 |
| 16 | 0.60 | -1.00 | -0.20 | 0.40 |
| 17 | -0.10 | -0.37 | 0.21 | 0.35 |
| 18 | -0.62 | -1.43 | -0.95 | -0.50 |
| 19 | 0.06 | -1.33 | -0.47 | 0.66 |
| 20 | -0.18 | -1.03 | -1.53 | -0.45 |
The crowded end of that trade is where it concentrates. The top 50 high-beta momentum names are running -4.26%, a bottom-6% session since 2020, while the roughly 1,270 names in neither screen are +1.07% equal-weight. The better a name fit the high-beta momentum profile, the further it fell — the top 50 moved 2.0× the broader ~190-name group against a 1.14× norm. In Friday's session that group traded below the tape's pace and moved as one basket, at the 92nd percentile of its 60-day norm, the pattern of a book being taken down rather than opinions changing. Hedge-Fund Ownership is flat on both the residual and raw reads today (z=+0.5 and -0.2), so the direct positioning lenses do not name the seller.
The index leg has been near-absent all month: the market's share of trailing 20-day variance is 3.4%, versus 3.3% at Friday's close and in the 0.3rd percentile since 2020, while style factors carry 35.5% at the 91.9th percentile. The options market is starting to pay for that to change — implied single-stock correlation (Cboe COR1M) at 9.04 against 7.73 at Friday's close, and implied index volatility (Cboe VIX) at 19.92, up 1.34.
| ETF | Theme | Today | 1d Ago | 5d Ago | 20d Ago | 63d Ago |
|---|---|---|---|---|---|---|
| DRAM | memory chips & storage | -3.59% | -8.75% | +0.91% | -30.81% | +46.31% |
| SMH | semiconductors | -3.29% | -3.27% | +0.84% | -11.88% | +16.47% |
| MTUM | momentum | -2.53% | -2.42% | +1.42% | -9.70% | +11.06% |
| EWY | south korea | -2.11% | -6.27% | +0.26% | -20.51% | +8.21% |
| AIPO | AI power infrastructure | -2.74% | -3.74% | +0.45% | -11.42% | -4.15% |
| USO | oil | -7.24% | -2.01% | +10.27% | +25.05% | +1.46% |
| XOP | oil E&P | -2.54% | -0.92% | +2.27% | +12.48% | +2.65% |
| IGV | software | +3.51% | +1.01% | -5.19% | +3.80% | +5.28% |
| KWEB | china internet | +2.75% | +0.08% | -1.94% | +11.26% | -7.53% |
| XLK | technology | -1.43% | -1.44% | +0.17% | -4.71% | +12.86% |
Brent fell more than 9% to below $88 a barrel after US and Iranian forces paused two weeks of strikes over the weekend, as Bloomberg and the NYT reported. USO is -7.24% at twice the typical ETF pace and the median energy stock -1.93%, with Exxon -1.50% and Chevron -1.57% — but the Oil factor only managed -0.54% (z=-1.1), so the biggest commodity move of the month is barely visible in the equity cross-section. Yields fell across the curve, the 10-year to 4.655% (-2.4bp) and the 30-year to 5.135% (-2.7bp), as CNBC reported, and UK gilts touched one-week lows on the same news, as the Economic Times reported. Where cheaper fuel is a cost saving it showed: Macy's +6.16%, essentially all of it the stock's own move. Baker Hughes is +6.58% after reporting, running against its own sector.
Outside the memory names this is a rising market, and that is the check on reading today as broad de-risking. Alphabet is +3.25%, Meta +1.77%, the median communication services stock +2.33%, software IGV +3.51% after -5.19% across the prior five sessions, and SPY +0.09%. Tyson +6.65% and JBS +8.36% jumped after the USDA said it would resume cattle shipments from Mexico, as Bloomberg reported. And the memory drawdown still sits inside an enormous run: DRAM is +46.31% over 63 sessions and SMH +16.47%, with the Semis factor's 63-day z at just -0.4. A month of damage has not yet dented the year.
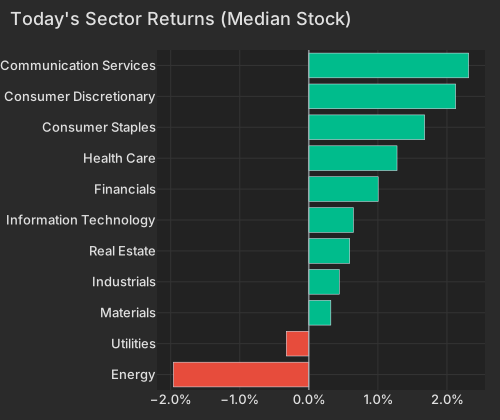
| Sector | Median Ret Pct |
|---|---|
| Energy | -1.96 |
| Utilities | -0.33 |
| Materials | 0.32 |
| Industrials | 0.44 |
| Real Estate | 0.59 |
| Information Technology | 0.65 |
| Financials | 1.00 |
| Health Care | 1.28 |
| Consumer Staples | 1.68 |
| Consumer Discretionary | 2.12 |
| Communication Services | 2.31 |
Where to look in a book: DRAM, SMH, EWY and MTUM for the direct exposure, AIPO and DTCR for the adjacent AI-power names dragged along at -2.74% and -1.78%, and single-name risk in MU, WDC, STX, SNDK, TER, LITE, TSEM and SIMO, where the loss is coming through the momentum and semis complex rather than anything either company said. Cadence reports after the close and is +4.58% into it, the one large semiconductor-adjacent name going the other way today.
The Dallas Fed Manufacturing Survey, released at 10:30 AM ET, showed the general business activity index at 1.3 in July against a -1.0 consensus and June's 0.0, with new orders accelerating to 6.4 from 2.3 and prices paid easing to 41.3 from 42.4. It lands two days before the Federal Reserve's rate decision on July 29, with Microsoft, Meta and Apple all reporting into the same window, as the WSJ and FT reported.
Variance decomposition: live intraday — 20260727 session, bracketed against its trailing-year range. Factor returns are trailing through last close. Total cross-sectional dispersion: 67%ile of the past year.
Variance mix — % of total, today vs 1d ago vs 1-yr avg
market 51%ile style 98.4%ile thematic 72%ile idiosyncratic 6.0%ile
Variance explained — today vs. factor's trailing-year range
Marker = the factor's share of today's total variance, placed in its own trailing-year range (box 25–75%ile, ticks 90%ile and max). Amber marker = unusually load-bearing today (≥90%ile of its own year). Factor name green = up today / red = down.
Correlation & dispersion — realized vs implied
Pairwise realized correlation (20d): 4.19% 0.2%ile since 2020 · 6.3%ile 3m
Top-500 pairwise: 6.42% 1.5%ile since 2020 · 7.9%ile 3m · implied (Cboe COR1M): 9.04 2.4%ile of its own history (gap -2.6pp)
Realized 20d vol (ann. pts): all stocks 45 vs VIXEQ 49 · index 8 vs VIX 20 · style factors 27 91.9%ile
20-day window (19 completed days + today); percentiles vs model history since 2020; '3m' tokens rank vs the trailing 63 trading days; definitions in Terms below. Implied prints (Cboe) are delayed ~15 min. as of 10:58 ET
Top 50 high-beta momentum names (eq-wt, since-2020 rank): -4.3% 5.9%ile · rest of market +1.1%
| Factor | Today | 1d | 5d | 20d | 60d |
|---|---|---|---|---|---|
| Style-Risk | |||||
| Beta | -0.90% z-0.9 | -2.18% | -1.24% | -8.52% | -0.95% |
| International | +0.09% z+0.3 | -0.08% | +0.23% | +1.21% | -1.36% |
| Residual Volatility | +0.14% z+0.3 | -0.65% | -1.01% | -0.52% | -1.84% |
| Style | |||||
| Dividend Yield | -0.38% z-2.0 | -0.19% | -0.08% | -0.36% | +0.36% |
| Leverage | -0.29% z-1.6 | -0.08% | +0.45% | -1.15% | -0.38% |
| Size | -0.35% z-0.9 | +0.04% | -0.53% | +0.52% | -0.57% |
| Profitability | -0.09% z-0.5 | +0.06% | +0.27% | -0.28% | -0.78% |
| Growth | +0.07% z+0.3 | +0.05% | +0.07% | +1.47% | +2.25% |
| Liquidity | -0.07% z-0.2 | -0.69% | -0.19% | -0.64% | -1.56% |
| Value | -0.05% z-0.2 | +0.26% | +0.59% | -0.20% | -1.05% |
| Style-Momentum | |||||
| Long-Term Momentum | -2.04% z-3.1 | -1.38% | -0.70% | -3.89% | +0.46% |
| Short-Term Momentum | -1.02% z-3.0 | -0.47% | -2.13% | -3.54% | -4.50% |
| Medium-Term Momentum | +0.87% z+3.0 | +0.68% | -0.52% | -2.06% | +2.02% |
| One-Day Momentum | +0.63% z+2.2 | -0.25% | +0.52% | -0.76% | +1.37% |
| Style-Positioning | |||||
| Short Interest | +0.29% z+1.7 | +0.17% | -0.32% | +0.20% | +1.54% |
| Hedge-Fund Ownership | +0.05% z+0.5 | -0.03% | -0.34% | +0.20% | -0.90% |
| Style-Flow | |||||
| Short-Sale Activity | +0.09% z+0.8 | +0.11% | -0.06% | +0.15% | -0.02% |
| Morning Activity | +0.10% z+0.7 | -0.06% | -0.08% | +0.00% | -1.10% |
| Thematic | |||||
| Semiconductors | -2.31% z-3.9 | -1.39% | -0.86% | -4.01% | -1.67% |
| Oil | -0.54% z-1.1 | -0.78% | -1.06% | +1.07% | -2.74% |
| Treasury (Duration) | -0.30% z-0.9 | +0.18% | +0.96% | +0.61% | +0.95% |
| Bitcoin / Crypto | +0.22% z+0.7 | -0.27% | -0.31% | -0.54% | -0.81% |
| China | +0.11% z+0.3 | +0.14% | -0.10% | +1.00% | -4.60% |
| Gold | +0.05% z+0.1 | +0.20% | +1.03% | +1.58% | -2.16% |
5/20/60d windows include today's session; 1d is the previous session.
Market variance share. The fraction of cross-sectional variance explained by the market factor — the attribution companion to pairwise correlation, not a substitute for it.
Factor z-score. Today's factor return divided by its daily-return standard deviation over ~1,600 trading days.
High-beta momentum cohort. US names above $2B market cap in the top quintile of both raw beta and 12-month momentum; membership frozen at each month's first business day. “Top 50” = the 50 strongest by combined rank.
Stock-specific (idiosyncratic) return. The part of a stock's move not explained by market, style, or thematic factors in our decomposition.
VIXEQ / DSPX / COR1M. Cboe implied indices: single-stock volatility, dispersion, and 1-month implied correlation (top-50 S&P names). Quotes delayed ~15 minutes.
Data compiled by FactorPulse AI; edited and verified by Jeff Klein. For informational purposes only. Does not constitute financial advice, an investment recommendation, or an offer to buy or sell any securities. Always consult a qualified financial professional before making investment decisions.
For more on factor construction methodology, see www.factorpulse.com/glossary.