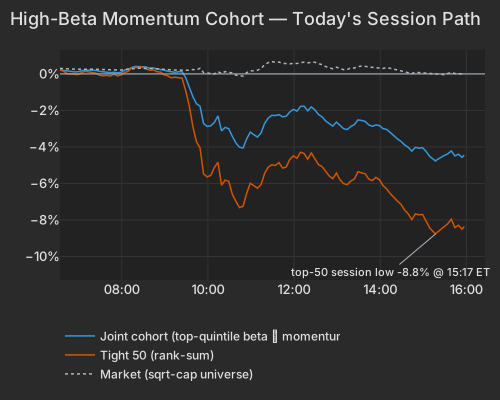
Goldman Sachs Prime Services, in a July 22 note led by Vincent Lin, called this month's technology selling a "healthy reset" rather than a loss of faith in AI, with hedge fund AI positioning back to the 65th percentile from five-year extremes. Our own version of that trade answered the same day: the top 50 high-beta momentum names are down -8.38% while the rest of the universe rose +1.12%. Healthy, contained, and not finished — today the selling got more concentrated, not less.
The path leaves little room for a benign reading. The group was +0.40% at 08:26, bottomed at -8.77% at 15:17, and sits near -8.36%. The broad universe never travelled more than 0.8 points in either direction and is unchanged on the session — a +0.02% day for SPY covering an eight-point hole underneath it.
| Series | Ret Pct |
|---|---|
| joint | -4.42 |
| tight50 | -8.38 |
| market | 0.05 |
| rest | 1.12 |
Beta is the engine: -2.20% at z=-2.24, explaining 30.8% of today's cross-sectional variance, with its highest-exposure bucket down -6.49%. Long-Term Momentum is -1.39% (z=-2.13) — one-year winners underperforming one-year laggards, the known momentum-crash pattern after an extended run rather than a verdict on the momentum premium. Semiconductors -1.40% (z=-2.35) and Liquidity -2.38σ complete the picture, the latter meaning the lowest-turnover names beat the highest-turnover, most heavily optioned ones. None of this began this morning: over the trailing 20 sessions Beta has returned -6.40%, Semiconductors -1.05%, Long-Term Momentum -0.66%.
| Factor | Return | Z-Score | 5d Z | 20d Z | 63d Z | Category | Direction |
|---|---|---|---|---|---|---|---|
| Beta | -2.20% | -2.24 | -0.11 | -2.14 | -0.15 | Style-Risk | High-beta names lagged |
| Liquidity | -0.69% | -2.38 | 0.98 | -0.14 | -0.44 | Style | Lowest-turnover names led |
| Semiconductors | -1.40% | -2.35 | 1.21 | -1.38 | 0.19 | Thematic | Chip-exposed names lagged |
| Medium-Term Momentum | +0.68% | +2.32 | -2.33 | -2.14 | 0.94 | Style-Momentum | 1-month winners kept leading |
| Long-Term Momentum | -1.39% | -2.13 | 0.86 | -1.21 | 0.59 | Style-Momentum | 1-year winners lagged |
| Short-Sale Activity | +0.12% | +1.04 | -0.77 | -0.05 | -0.23 | Style-Flow | Yesterday's short-sold names led |
| Short Interest | +0.17% | +0.97 | -2.20 | 0.18 | 0.86 | Style-Positioning | Most-shorted names led |
| Hedge-Fund Ownership | -0.03% | -0.24 | -1.73 | 0.90 | -0.96 | Style-Positioning | Flat as a residual |
Medium-Term Momentum looks like the odd one out at +0.68% and z=+2.32, its 99th percentile since 2020. It is the same selling under another name. After this month's damage the one-month baskets reformed, and exposure to that factor now runs at a -0.36 correlation with the high-beta momentum group — so "recent one-month winners beat recent one-month losers" and "the beta-momentum names got hit" are one statement, not two.
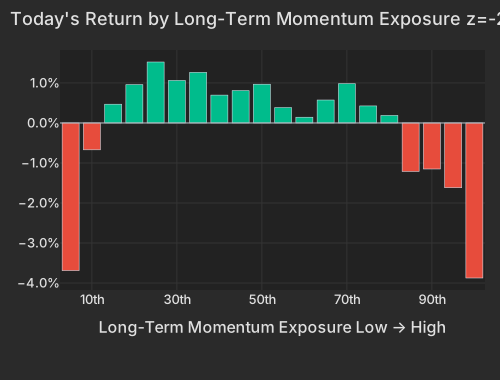
| Bucket | Avg Ret Pct |
|---|---|
| 1 | -3.69 |
| 2 | -0.67 |
| 3 | 0.47 |
| 4 | 0.96 |
| 5 | 1.52 |
| 6 | 1.06 |
| 7 | 1.26 |
| 8 | 0.70 |
| 9 | 0.81 |
| 10 | 0.97 |
| 11 | 0.38 |
| 12 | 0.14 |
| 13 | 0.57 |
| 14 | 0.98 |
| 15 | 0.43 |
| 16 | 0.19 |
| 17 | -1.21 |
| 18 | -1.15 |
| 19 | -1.62 |
| 20 | -3.87 |
Intel is down -8.03% on Q2 revenue of $16.13B, up 25% year over year and above consensus, with non-GAAP EPS at double the estimateMarketWatch. Split the move and the company is barely in it: style factors account for -7.21% and Intel's own contribution is -0.11%. Its exposures did the work — one-year momentum +3.4σ, semis +2.3σ, beta +2.2σ. Micron is the cleaner case: -6.95% on the day, style -8.08%, and the stock's own move was positive at +1.94%, on a week when DRAM spot prices set highs and its high-bandwidth memory capacity is reported sold out through 2027MarketWatch.
The same signature runs down the list of the day's largest factor-carried decliners: SanDisk -10.86%, Nebius -14.76%, Bloom Energy -14.82%, Applied Optoelectronics -10.44%, AXT -10.84% — beta the dominant factor in each, stock-specific components near zero. In the fund complex it shows up as memory and Korea: DRAM -8.52% against +56.30% over 63 sessions, and EWY -6.23% even as Samsung and SK Hynix finalise large US supply dealsBloomberg.
| ETF | Theme | Today | 1d Ago | 5d Ago | 20d Ago | 63d Ago |
|---|---|---|---|---|---|---|
| DRAM | memory chips & storage | -8.52% | +0.92% | +11.39% | -16.63% | +56.30% |
| WGMI | crypto miners | -8.05% | +1.94% | +21.14% | -12.72% | +16.35% |
| EWY | south korea | -6.23% | +2.01% | +6.43% | -11.86% | +11.59% |
| AIPO | AI power infrastructure | -3.57% | +0.63% | +4.10% | -7.41% | +1.06% |
| SMH | semiconductors | -3.26% | -1.15% | +1.98% | -6.26% | +21.67% |
| MTUM | momentum | -2.22% | -0.08% | +3.48% | -4.39% | +13.76% |
| SPY | large cap | +0.02% | -1.23% | -1.67% | +0.67% | +3.79% |
| IGV | software | +1.31% | -2.16% | -7.04% | +1.08% | -1.85% |
| IYR | real estate | +2.19% | -0.23% | -1.45% | +1.81% | +4.05% |
| ITB | homebuilders | +2.69% | -0.94% | -5.64% | -8.50% | -5.24% |
The short side is where our data independently corroborates the de-grossing claim. Short Interest printed +0.17% at z=+0.97: the most heavily shorted names outperformed the barely-shorted ones, against the largest persistent drag in the model. Short-Sale Activity printed +0.12% at z=+1.04: yesterday's most heavily short-sold names outperformed today, against the model's most statistically reliable effect. Both are small in basis points and both cut the same way — longs sold and shorts covered in the same session.
Hedge-Fund Ownership is flat as a residual factor at z=-0.24 but negative on a raw basis (-0.11%, z=-0.74). Read as a pair, that says hedge-fund-owned names were hit and were hit through their beta and momentum tilts, which the model absorbs upstream — the ownership axis itself was not the sorting variable. Our lenses identify the trade being sold; the seller stays unattributed by anything in the pipeline.
The microstructure is not uniform. In yesterday's session the group traded at 0.4× the tape's volume pace, its members did not move as one basket — intra-group co-movement sat in the bottom decile of the past 60 days — and the easiest-to-sell names were not sold first, with the most liquid third at +0.06% and the least liquid third at -1.89%. Today the selling rank-orders sharply: the top 50 fell 1.9 times as far as the broader cohort, well beyond the usual proportion. The more a name fits the high-beta, high-momentum profile, the harder it fell.
Everything outside those names absorbed it without complaint. High-yield credit is unchanged (HYG -0.03%), implied index volatility (Cboe VIX) sits at 18.83, the 56.9th percentile of its own history, and the median stock in Real Estate, Consumer Staples, Financials and Consumer Discretionary is higher. That containment is the strongest evidence for Lin's characterisation; the concentration is the evidence against calling it finished.
The bid was in names with no beta-momentum tilt at all, and it was overwhelmingly stock-specific. Digital Realty rose +10.81% after raising full-year core FFO guidance on record hyperscale leasing backlogEconomic Times — the largest own-move in its trailing year, and the same AI buildout BlackRock is funding with a $12.3 billion bond sale for Meta's data centreBloomberg. Tenet Healthcare +17.18% on a Q2 beat and a $2 billion buybackEconomic Times, SLB +11.07% on its Q2 beat and a $10 billion Q4 revenue outlookBloomberg, SAP +9.34% on cloud revenue above estimatesBloomberg, RingCentral +25.16%, SS&C +10.34%. Real estate funds ran +2.2% with IYR at 2.0× the typical ETF pace.
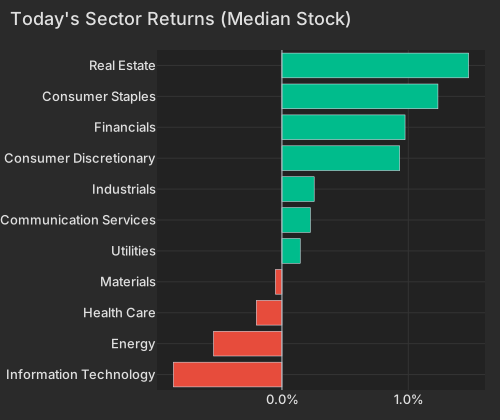
| Sector | Median Ret Pct |
|---|---|
| Information Technology | -0.86 |
| Energy | -0.54 |
| Health Care | -0.20 |
| Materials | -0.05 |
| Utilities | 0.14 |
| Communication Services | 0.22 |
| Industrials | 0.26 |
| Consumer Discretionary | 0.93 |
| Financials | 0.97 |
| Consumer Staples | 1.23 |
| Real Estate | 1.48 |
Worth noting what did not cause any of this. The Treasury curve eased across every tenor today — the 10-year at 4.679%, down 2.4 bp, the 20-year at 5.189% and the 30-year at 5.163%CNBC — and Brent slipped back under $100 after Wednesday's spike, with USO -1.65%Bloomberg. Homebuilders took the relief, ITB +2.69% after -8.50% over 20 sessions. Futures still carry a 38% chance of a hike on July 29CNBC. Both macro pressures on this complex relaxed, and the beta-momentum names had their 10th-worst day since 2020 anyway.
Style factors are carrying 51.4% of today's cross-sectional variance against a one-year average near 20%, while the index leg explains essentially none of it (3.5th percentile). On the blended 20-day window, realized style volatility sits at 27.4 vol points, the 93.2nd percentile since 2020, against 8.4 points for the index component at the 1.2nd percentile. The options market is priced for exactly this shape: implied single-stock volatility (Cboe VIXEQ) at 47.77 versus implied index volatility at 18.83, and implied dispersion (Cboe DSPX) at 43.91, the 99.1st percentile of its history. Realized 20-day pairwise correlation remains at 4.12%, the 0.2nd percentile since 2020 and the 4.8th of the past three months — an extreme that has been in place for weeks, not one set today.
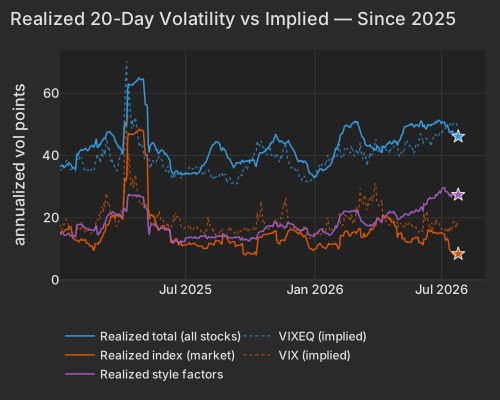
| Series | Today Vol Pts | Prev Close Vol Pts |
|---|---|---|
| total | 46.10 | 46.21 |
| market | 8.40 | 8.58 |
| style | 27.40 | 26.85 |
For a book, the checklist is short: SMH, DRAM, AIPO, MTUM and EWY on the exposed side; Intel, Micron, SanDisk, Nebius and Bloom Energy as the names where the factor, not the fundamentals, is setting the price; DLR, SLB, SAP and the real estate funds as where the offsetting bid actually went.
The S&P Global Flash US Composite PMI, released at 9:45 AM ET, rose to 53.6 from 51.9 — the fastest expansion since November — as services jumped to 53.6 against a 51.5 consensus while manufacturing slipped to a three-month low of 53.8, missing 54.3. Selling-price inflation accelerated to a near four-year peak on supply-chain delays and Middle East-linked input costs, the part of the print that matters most into next week's FOMC federalreserve.gov.
The New York Fed Staff Nowcast, released at 12:45 PM ET, left its 2026:Q2 GDP bea.gov estimate unchanged at 2.8% and Q3 at 2.6%, with this week's flash PMI and new home sales landing neutral for the growth track. The FOMC is now in its pre-meeting blackout ahead of July 29.
Variance decomposition: live intraday — 20260724 session, bracketed against its trailing-year range. Factor returns are trailing through last close. Total cross-sectional dispersion: 74%ile of the past year.
Variance mix — % of total, today vs 1d ago vs 1-yr avg
market 5.2%ile style 98.4%ile thematic 51%ile idiosyncratic 9.6%ile
Variance explained — today vs. factor's trailing-year range
Marker = the factor's share of today's total variance, placed in its own trailing-year range (box 25–75%ile, ticks 90%ile and max). Amber marker = unusually load-bearing today (≥90%ile of its own year). Factor name green = up today / red = down.
Correlation & dispersion — realized vs implied
Pairwise realized correlation (20d): 4.12% 0.2%ile since 2020 · 4.8%ile 3m
Top-500 pairwise: 6.15% 1.2%ile since 2020 · 6.3%ile 3m · implied (Cboe COR1M): 8.01 1.4%ile of its own history (gap -1.9pp)
Realized 20d vol (ann. pts): all stocks 46 vs VIXEQ 48 · index 8 vs VIX 19 · style factors 27 93.2%ile
20-day window (19 completed days + today); percentiles vs model history since 2020; '3m' tokens rank vs the trailing 63 trading days; definitions in Terms below. Implied prints (Cboe) are delayed ~15 min. as of 15:58 ET
Top 50 high-beta momentum names (eq-wt, since-2020 rank): -8.4% 0.6%ile · rest of market +1.1%
| Factor | Today | 1d | 5d | 20d | 60d |
|---|---|---|---|---|---|
| Style-Risk | |||||
| Beta | -2.20% z-2.2 | -0.54% | +1.50% | -6.40% | +0.05% |
| Residual Volatility | -0.65% z-1.3 | -0.12% | +0.15% | +0.04% | -0.89% |
| International | -0.06% z-0.2 | -0.13% | +0.19% | +0.84% | -1.39% |
| Style | |||||
| Liquidity | -0.69% z-2.4 | -0.19% | +1.60% | -0.15% | -0.75% |
| Value | +0.26% z+1.1 | +0.03% | +0.18% | -0.63% | -1.18% |
| Dividend Yield | -0.18% z-1.0 | -0.07% | +0.68% | +0.14% | +1.02% |
| Leverage | -0.07% z-0.4 | +0.20% | +0.53% | -0.86% | +0.22% |
| Profitability | +0.06% z+0.3 | +0.21% | +0.10% | -0.50% | -0.71% |
| Growth | +0.05% z+0.2 | +0.33% | +0.02% | +1.36% | +2.01% |
| Size | +0.03% z+0.1 | -0.27% | -0.30% | -0.15% | +0.34% |
| Style-Momentum | |||||
| Medium-Term Momentum | +0.68% z+2.3 | -0.55% | -2.19% | -2.87% | +1.25% |
| Long-Term Momentum | -1.39% z-2.1 | +0.77% | +3.52% | -0.66% | +4.37% |
| Short-Term Momentum | -0.46% z-1.4 | +0.16% | -0.88% | -1.59% | -2.75% |
| One-Day Momentum | -0.25% z-0.8 | +0.11% | -0.55% | -1.33% | +1.45% |
| Style-Positioning | |||||
| Short Interest | +0.17% z+1.0 | -0.20% | -1.04% | -0.15% | +1.01% |
| Hedge-Fund Ownership | -0.03% z-0.2 | -0.03% | -0.52% | +0.49% | -0.97% |
| Style-Flow | |||||
| Short-Sale Activity | +0.12% z+1.0 | -0.21% | -0.36% | -0.40% | -0.29% |
| Morning Activity | -0.05% z-0.4 | -0.19% | -0.28% | -0.03% | -1.34% |
| Thematic | |||||
| Semiconductors | -1.40% z-2.4 | +0.80% | +3.44% | -1.05% | +2.18% |
| Oil | -0.77% z-1.5 | -0.07% | +1.43% | +1.72% | -0.24% |
| Bitcoin / Crypto | -0.26% z-0.9 | -0.32% | +0.24% | -0.40% | -1.05% |
| Gold | +0.23% z+0.7 | +0.03% | +1.05% | +1.27% | -3.53% |
| Treasury (Duration) | +0.19% z+0.5 | +0.25% | +0.87% | +1.14% | +0.38% |
| China | +0.16% z+0.4 | -0.61% | -0.07% | +0.40% | -5.08% |
Pairwise realized correlation. Index variance net of the weighted idiosyncratic diagonal, over the cross terms — the estimator used for implied-correlation indices. 20-day window unless noted; history since 2020.
Factor z-score. Today's factor return divided by its daily-return standard deviation over ~1,600 trading days.
High-beta momentum cohort. US names above $2B market cap in the top quintile of both raw beta and 12-month momentum; membership frozen at each month's first business day. “Top 50” = the 50 strongest by combined rank.
Dispersion (realized). Total cross-sectional volatility net of the market component; high dispersion is the flip side of low correlation.
Stock-specific (idiosyncratic) return. The part of a stock's move not explained by market, style, or thematic factors in our decomposition.
VIXEQ / DSPX / COR1M. Cboe implied indices: single-stock volatility, dispersion, and 1-month implied correlation (top-50 S&P names). Quotes delayed ~15 minutes.
Data compiled by FactorPulse AI; edited and verified by Jeff Klein. For informational purposes only. Does not constitute financial advice, an investment recommendation, or an offer to buy or sell any securities. Always consult a qualified financial professional before making investment decisions.
For more on factor construction methodology, see www.factorpulse.com/glossary.