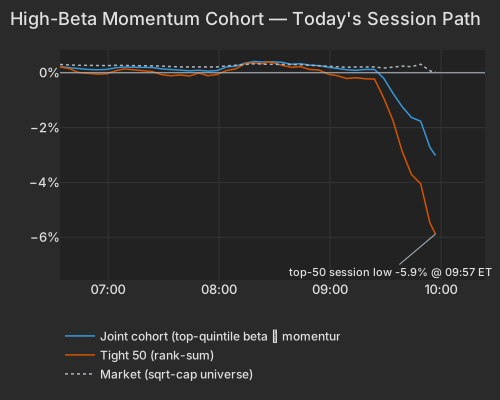
Alphabet's Q2 report set the fuse: management lifted 2026 capital-expenditure guidance to $195–$205 billion and posted its first negative free-cash-flow quarter since going public, pushing the Street to price the cash drain of the AI buildout rather than its promise FT. The blow did not land evenly. The crowded high-beta momentum cohort — the names that ran hardest into July — took the hit: the top 50 fell -5.77% and the broader ~190-name group -2.88%, while the roughly 1,270 names in neither screen rose +0.78%. This is day-three pressure on a trade that already suffered a Long-Term Momentum crash on July 1 and another extreme on July 21, not a fresh shock out of nowhere.
| Series | Ret Pct |
|---|---|
| joint | -2.88 |
| tight50 | -5.77 |
| market | 0.07 |
| rest | 0.78 |
The factor math says the same thing in cleaner form. Beta printed -1.56% (z=-1.58), the highest-beta stocks lagging the lowest, and that pressure ran straight through the biggest weights in the group. Micron fell -6.13% — but almost none of that is a memory story: the move decomposes almost entirely to the day's beta and momentum selling, with the stock's own contribution near zero. MaxLinear -15.01% and SanDisk -7.75% were both carried by Beta rather than fundamentals, and the Roundhill memory ETF (DRAM) dropped -6.86%.
| Factor | Return | Z-Score | 5d Z | 20d Z | 63d Z | Category | Direction |
|---|---|---|---|---|---|---|---|
| Beta | -1.56% | -1.58 | 0.18 | -2.00 | -0.07 | Risk | High-beta names lagged |
| Liquidity | -0.51% | -1.73 | 1.27 | -0.00 | -0.35 | Style | Most-liquid names lagged |
| Semiconductors | -0.84% | -1.41 | 1.63 | -1.17 | 0.31 | Thematic | High-semi names lagged |
| Dividend Yield | -0.22% | -1.21 | 0.66 | -0.46 | 0.53 | Style | High-yield names lagged |
| Long-Term Momentum | -0.75% | -1.15 | 1.30 | -0.99 | 0.72 | Momentum | 1-year winners lagged |
| Short-Term Momentum | -0.29% | -0.85 | -1.42 | -1.42 | -1.14 | Momentum | Recent winners gave back |
| Medium-Term Momentum | +0.31% | 1.05 | -2.9 | -2.4 | +0.8 | Momentum | Counter-run higher |
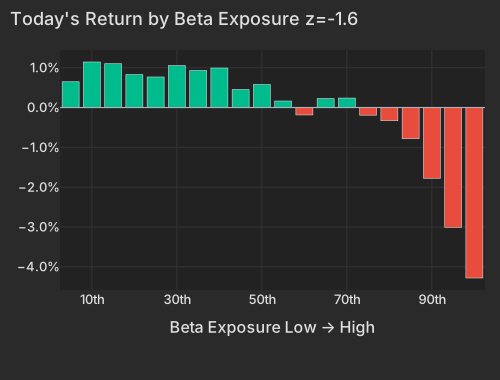
| Bucket | Avg Ret Pct |
|---|---|
| 1 | 0.65 |
| 2 | 1.14 |
| 3 | 1.10 |
| 4 | 0.83 |
| 5 | 0.77 |
| 6 | 1.06 |
| 7 | 0.93 |
| 8 | 0.99 |
| 9 | 0.45 |
| 10 | 0.58 |
| 11 | 0.16 |
| 12 | -0.19 |
| 13 | 0.23 |
| 14 | 0.24 |
| 15 | -0.19 |
| 16 | -0.33 |
| 17 | -0.78 |
| 18 | -1.78 |
| 19 | -3.01 |
| 20 | -4.28 |
The ETF market frames it as a reversal of exactly what led. The momentum factor fund (MTUM) fell -1.04% today but is still up +13.76% over 63 days; semiconductors (SMH) -1.82% against +21.67%; South Korea (EWY, home to Samsung and SK Hynix) -4.71%. What is bid instead is everything the high-beta trade is not — real estate (XLRE +2.28%) and energy (XLE +1.27%).
| ETF | Theme | Today | 1d Ago | 5d Ago | 20d Ago | 63d Ago |
|---|---|---|---|---|---|---|
| DRAM | memory chips | -6.86% | +0.92% | +11.39% | -16.63% | +56.30% |
| EWY | south korea | -4.71% | +2.01% | +6.43% | -11.86% | +11.59% |
| WGMI | crypto miners | -3.24% | +1.94% | +21.14% | -12.72% | +16.35% |
| SMH | semiconductors | -1.82% | -1.15% | +1.98% | -6.26% | +21.67% |
| MTUM | momentum | -1.04% | -0.08% | +3.48% | -4.39% | +13.76% |
| XLK | technology | -0.89% | -1.01% | +0.52% | -2.51% | +12.88% |
| XLRE | real estate | +2.28% | -0.13% | -1.12% | +0.99% | +3.43% |
| XLE | energy | +1.27% | +0.30% | +4.14% | +10.85% | +5.02% |
| USO | oil | -1.97% | +5.93% | +16.92% | +31.24% | +7.80% |
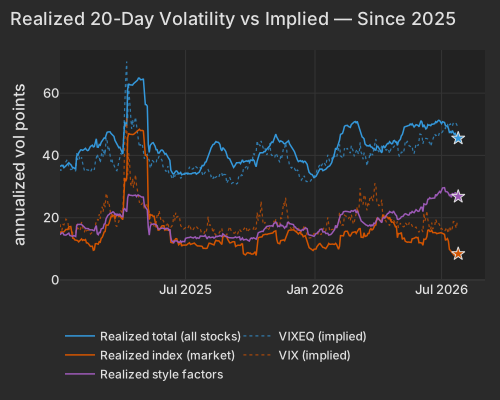
This is why the headline index tells you nothing today: the market factor explains just 3.4% of 20-day cross-sectional variance while the style block — led by Beta and Long-Term Momentum — accounts for roughly 35%. Realized single-stock correlation, at 4.24% (the 0.3rd percentile since 2020), remains pinned near the lows set over the past week, and implied one-month single-stock correlation (Cboe COR1M) at 7.79 sits in the lowest ~1.2% of its 20-year history. Realized index volatility is only 8.4 vol points against realized style volatility of 26.8, near stress-episode levels. All the movement is in the factor axes; the index-level calm hides it.
| Series | Today Vol Pts | Prev Close Vol Pts |
|---|---|---|
| total | 45.50 | 46.21 |
| market | 8.40 | 8.58 |
| style | 26.80 | 26.85 |
The shape of the selling points to positioning, not fundamentals. The top-50 names moved 2.0× the broader group today versus a 1.14× norm — selling rank-ordered on the beta-momentum characteristic itself, the signature of a systematic unwind. The prior session's flow read was more mixed: volume ran below the tape's pace and there was no liquid-first ordering, so this looks less like forced deleveraging than a deliberate paring of the winners. The strongest case that it stays contained is its breadth — the median stock in most sectors is higher, and only Information Technology (-0.99%) is red — a one-trade event, not the start of a broad drawdown.
The multi-week stagflation trade — $100 Brent after Houthi strikes on Red Sea tankers, the 30-year Treasury yield near multi-decade highs Bloomberg — took a breather exactly as the high-beta selling accelerated, which is the tell that today is about positioning. Brent fell 3.3% after touching triple digits, dragging USO -1.97% Bloomberg, and the curve eased across the board: the 10-year to 4.67% (down 3.2bps), the 30-year to 5.15% CNBC. With the macro pressure off for a session and the high-beta trade still bleeding, the driver is neither rates nor oil. Energy was the one high-beta corner spared — SLB rose +8.59% on results.
The day's largest single moves had nothing to do with the factor story. Tenet Healthcare jumped +22.54% — its biggest own-move in a year — after a Q2 beat, a raised 2026 EBITDA outlook and a $2 billion buyback expansion Economic Times. American Express fell -5.82%, almost all of it stock-specific, as a slight revenue miss and a 12% jump in expenses overshadowed an EPS beat. And Digital Realty rose +13.02% on a raised full-year FFO forecast tied to AI data-center demand Economic Times — a reminder that AI-infrastructure demand itself is intact; what is being marked down is the capital intensity and valuation of the high-beta names, not the theme. Intel, reporting into the same selloff, fell -3.84% despite a non-GAAP beat STRAITSTIMES.
The S&P Global flash US Composite PMI, released at 9:45 AM ET, rose to 53.6 in July from 51.9 — the fastest expansion since November — as services jumped to 53.6 against a 51.2 consensus while manufacturing slipped to a four-month low of 53.8. Selling-price inflation ran near a four-year high, consistent with the energy-cost pressure behind the global bond selloff.
The New York Fed Staff Nowcast is scheduled for 12:45 PM ET but remains suspended; traders lean on the Weekly Economic Index as the real-time growth proxy in the interim.
Variance decomposition: live intraday — 20260724 session, bracketed against its trailing-year range. Factor returns are trailing through last close. Total cross-sectional dispersion: 19%ile of the past year.
Variance mix — % of total, today vs 1d ago vs 1-yr avg
market 8.8%ile style 97.2%ile thematic 42%ile idiosyncratic 14%ile
Variance explained — today vs. factor's trailing-year range
Marker = the factor's share of today's total variance, placed in its own trailing-year range (box 25–75%ile, ticks 90%ile and max). Amber marker = unusually load-bearing today (≥90%ile of its own year). Factor name green = up today / red = down.
Correlation & dispersion — realized vs implied
Pairwise realized correlation (20d): 4.24% 0.3%ile since 2020 · 7.9%ile 3m
Top-500 pairwise: 6.44% 1.5%ile since 2020 · 7.9%ile 3m · implied (Cboe COR1M): 7.79 1.2%ile of its own history (gap -1.4pp)
Realized 20d vol (ann. pts): all stocks 46 vs VIXEQ 49 · index 8 vs VIX 19 · style factors 27 91.4%ile
20-day window (19 completed days + today); percentiles vs model history since 2020; '3m' tokens rank vs the trailing 63 trading days; definitions in Terms below. Implied prints (Cboe) are delayed ~15 min. as of 09:58 ET
Top 50 high-beta momentum names (eq-wt, since-2020 rank): -5.8% 2.7%ile · rest of market +0.8%
| Factor | Today | 1d | 5d | 20d | 60d |
|---|---|---|---|---|---|
| Style-Risk | |||||
| Beta | -1.56% z-1.6 | -0.54% | +1.50% | -6.40% | +0.05% |
| Residual Volatility | -0.46% z-0.9 | -0.12% | +0.15% | +0.04% | -0.89% |
| International | +0.03% z+0.1 | -0.13% | +0.19% | +0.84% | -1.39% |
| Style | |||||
| Liquidity | -0.51% z-1.7 | -0.19% | +1.60% | -0.15% | -0.75% |
| Dividend Yield | -0.22% z-1.2 | -0.07% | +0.68% | +0.14% | +1.02% |
| Value | +0.22% z+0.9 | +0.03% | +0.18% | -0.63% | -1.18% |
| Leverage | +0.08% z+0.4 | +0.20% | +0.53% | -0.86% | +0.22% |
| Profitability | +0.05% z+0.3 | +0.21% | +0.10% | -0.50% | -0.71% |
| Growth | +0.04% z+0.1 | +0.33% | +0.02% | +1.36% | +2.01% |
| Size | +0.03% z+0.1 | -0.27% | -0.30% | -0.15% | +0.34% |
| Style-Momentum | |||||
| Long-Term Momentum | -0.75% z-1.1 | +0.77% | +3.52% | -0.66% | +4.37% |
| Medium-Term Momentum | +0.31% z+1.1 | -0.55% | -2.19% | -2.87% | +1.25% |
| Short-Term Momentum | -0.29% z-0.8 | +0.16% | -0.88% | -1.59% | -2.75% |
| One-Day Momentum | -0.21% z-0.7 | +0.11% | -0.55% | -1.33% | +1.45% |
| Style-Positioning | |||||
| Short Interest | -0.03% z-0.2 | -0.20% | -1.04% | -0.15% | +1.01% |
| Hedge-Fund Ownership | -0.01% z-0.1 | -0.03% | -0.52% | +0.49% | -0.97% |
| Style-Flow | |||||
| Short-Sale Activity | +0.10% z+0.8 | -0.21% | -0.36% | -0.40% | -0.29% |
| Morning Activity | +0.03% z+0.2 | -0.19% | -0.28% | -0.03% | -1.34% |
| Thematic | |||||
| Semiconductors | -0.84% z-1.4 | +0.80% | +3.44% | -1.05% | +2.18% |
| Bitcoin / Crypto | -0.23% z-0.8 | -0.32% | +0.24% | -0.40% | -1.05% |
| Oil | -0.37% z-0.7 | -0.07% | +1.43% | +1.72% | -0.24% |
| Gold | +0.22% z+0.7 | +0.03% | +1.05% | +1.27% | -3.53% |
| Treasury (Duration) | +0.13% z+0.4 | +0.25% | +0.87% | +1.14% | +0.38% |
| China | +0.12% z+0.3 | -0.61% | -0.07% | +0.40% | -5.08% |
Factor z-score. Today's factor return divided by its daily-return standard deviation over ~1,600 trading days.
High-beta momentum cohort. US names above $2B market cap in the top quintile of both raw beta and 12-month momentum; membership frozen at each month's first business day. “Top 50” = the 50 strongest by combined rank.
Stock-specific (idiosyncratic) return. The part of a stock's move not explained by market, style, or thematic factors in our decomposition.
VIXEQ / DSPX / COR1M. Cboe implied indices: single-stock volatility, dispersion, and 1-month implied correlation (top-50 S&P names). Quotes delayed ~15 minutes.
Data compiled by FactorPulse AI; edited and verified by Jeff Klein. For informational purposes only. Does not constitute financial advice, an investment recommendation, or an offer to buy or sell any securities. Always consult a qualified financial professional before making investment decisions.
For more on factor construction methodology, see www.factorpulse.com/glossary.