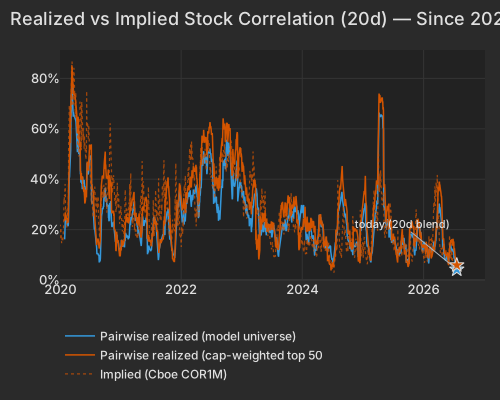
This is the quant signature that makes the day unusual: an index that looks quiet hides names being torn apart. Realized pairwise correlation of 4.2% and the market's 3.4% share of variance are both at the 0.2nd percentile since 2020, and the implied side agrees — Cboe's 1-month single-stock correlation index (COR1M) sits at 7.36, the 0.9th percentile of its 20-year history. Both backward-looking realized and forward-looking implied correlation are near their lowest on record, so the options market is priced for the churn to persist, not fade.
| Series | Today Pct | Prev Close Pct |
|---|---|---|
| pairwise_model | 4.20 | 3.93 |
| pairwise_top500 | 5.88 | 5.63 |
| implied_cor1m |
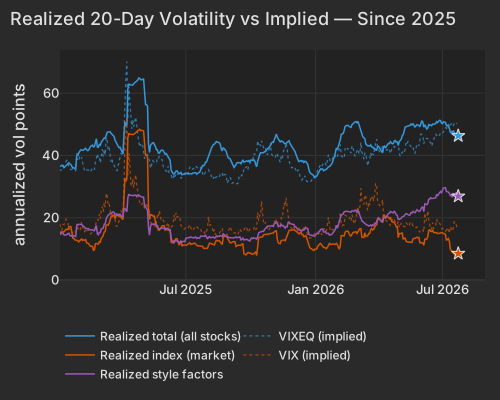
The volatility split says the same thing from the other side. Implied single-stock vol (Cboe VIXEQ) is 49.5, the 98th percentile, while implied index vol (VIX) is only 18.7, near its middle — investors are paying up for individual-name risk and almost nothing for the index. Over the trailing month the style block has done unusually heavy lifting (realized style vol 26.9 points, 91.5th percentile, led by beta and long-term momentum), yet the index-level vol underneath it is stuck at 8.5 points, the 1.5th percentile. Names are moving; they just are not moving together.
| Series | Today Vol Pts | Prev Close Vol Pts |
|---|---|---|
| total | 46.30 | 46.23 |
| market | 8.50 | 8.24 |
| style | 26.90 | 27.11 |
The largest single contributors are earnings and spending stories, priced one name at a time. Alphabet fell -6.82% after raising full-year capex guidance to $195–205bn and posting its first negative free cash flow since the 2004 IPO, even with Google Cloud up 82% Financial TimesBloomberg. Tesla dropped -13.49% — a $187bn market-cap hit — on an earnings miss and a pledge to spend big on AI and robotics; the decomposition puts almost all of it (idio z=-5.19) in the stock itself, not in any factor. Albertsons cratered -21.54% after cutting its outlook on softening grocery demand CNBC, the day's most extreme stock-specific move (idio z=-11.14), and Liberty Energy fell -21.40% as a 50% capex hike buried an earnings beat Bloomberg.
| Factor | Return | Z-Score | 5d Z | 20d Z | 63d Z | Category | Direction |
|---|---|---|---|---|---|---|---|
| Medium-Term Momentum | -0.68% | -2.33 | -3.55 | -2.30 | 0.54 | Style-Momentum | Month's winners gave back vs month's losers |
| Short-Sale Activity | -0.22% | -1.90 | -1.44 | -0.80 | -0.56 | Style-Flow | Barely-shorted names beat the most short-sold |
| Semiconductors | +0.99% | 1.66 | 2.72 | -0.32 | 0.83 | Thematic | High-exposure chip names outperformed |
| Long-Term Momentum | +0.95% | 1.45 | 2.53 | -0.16 | 1.07 | Style-Momentum | 1-year winners beat 1-year laggards |
| China | -0.58% | -1.42 | -0.05 | 0.23 | -1.61 | Thematic | China-exposed names lagged |
| Leverage | +0.26% | 1.38 | 1.39 | -0.96 | 0.18 | Style | More-levered names outperformed |
Semiconductors carried the highest conditional importance of any factor today (0.30) and read positive at z=+1.66: high-exposure names outperformed, led by Intel firming +7.06% into its after-the-close report. That the same factor could be positive while STMicroelectronics collapsed -18.25% on a profit miss and soft guidance is the whole point — STM's drop is idiosyncratic (own-move -16.8%), not a chip-sector verdict.
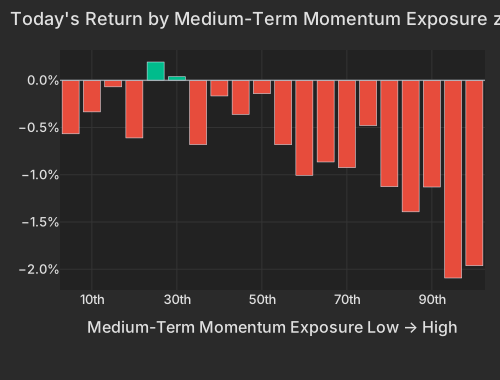
The residual signal is in the momentum horizons pulling apart. Medium-Term Momentum sits at z=-2.33 today and a five-day z=-3.55 — the past month's winners, the mega-cap tech leaders among them, gave back relative to the past month's laggards. Yet Long-Term Momentum stayed positive at z=+1.45: the one-year winners still beat the one-year laggards, the longer trend intact. The fast signal reversed while the slow one held, which reads as recent leaders being trimmed rather than a wholesale abandonment of the winners.
| Bucket | Avg Ret Pct |
|---|---|
| 1 | -0.57 |
| 2 | -0.33 |
| 3 | -0.07 |
| 4 | -0.61 |
| 5 | 0.19 |
| 6 | 0.04 |
| 7 | -0.68 |
| 8 | -0.17 |
| 9 | -0.36 |
| 10 | -0.14 |
| 11 | -0.68 |
| 12 | -1.01 |
| 13 | -0.86 |
| 14 | -0.92 |
| 15 | -0.48 |
| 16 | -1.13 |
| 17 | -1.39 |
| 18 | -1.13 |
| 19 | -2.09 |
| 20 | -1.96 |
The clean version of this story would be pure single-stock churn — but the growth complex sold too broadly for that. IGV (software) fell -2.12%, ARKK -2.60%, QQQ -1.43%, and the communication-services and discretionary blocks dropped -3.07% and -4.45%. That is a directional reassessment of the AI capital cycle sitting inside the dispersion regime, not merely names drifting on their own — and it is the reason a PM should not treat today's calm index as the real signal.
Underneath the tech selling, energy and defense rallied on the geopolitics. Brent pushed past $100 for the first time since May after Houthi strikes on two Saudi tankers in the Red Sea, sending USO up +6.80% on 2.4× its typical session pace Washington PostNYT. Defense was the day's cleanest winner: Lockheed jumped +9.93% on a beat-and-raise built on faster missile output, RTX added +6.60% on a record backlog, and ITA rose +3.18%.
| ETF | Theme | Today | 1d Ago | 5d Ago | 20d Ago | 63d Ago |
|---|---|---|---|---|---|---|
| USO (2.4× vol) | oil | +6.80% | +2.20% | +8.49% | +18.35% | +2.67% |
| ITA | defense | +3.18% | +0.60% | -2.25% | -2.04% | +3.60% |
| XLI | industrials | +2.03% | +0.11% | -0.67% | +0.39% | +4.32% |
| GLD | gold | -1.96% | +1.15% | +1.82% | +0.48% | -11.74% |
| QQQ | large-cap growth | -1.43% | -0.51% | -1.73% | -1.16% | +9.47% |
| IGV | software | -2.12% | -3.05% | -5.24% | +1.95% | +2.70% |
| ARKK | innovation growth | -2.60% | -2.14% | -4.48% | -0.85% | -1.74% |
| XLC | communication svcs | -3.07% | -0.75% | -3.69% | +1.80% | -6.79% |
| XLY | consumer discretionary | -4.45% | -0.74% | -2.55% | +0.23% | -4.16% |
The oil move fed straight into rates. The 10-year Treasury yield reached a 2026 high of 4.70%, up 4bps, and the 2-year rose 4.9bps to 4.35% as money markets lifted the odds of a Fed hike CNBCBloomberg. The front end moved more than the long end (30-year up just 1.8bps to 5.17%), a hike-driven flattening rather than a growth story. A firmer dollar (DXY +0.32% to 101.45) and those higher real yields help explain gold's slide — GLD -1.96%, GDX -1.80% — even on a geopolitical scare that would normally bid it CNBC.
| Sector | Median Ret Pct |
|---|---|
| Consumer Staples | -1.94 |
| Consumer Discretionary | -1.68 |
| Communication Services | -1.32 |
| Materials | -1.04 |
| Information Technology | -0.94 |
| Financials | -0.88 |
| Real Estate | -0.54 |
| Health Care | -0.00 |
| Energy | 0.11 |
| Industrials | 0.14 |
| Utilities | 0.32 |
For a book, the instruments to check are the ones the dispersion pins to opposite corners: the AI-capex names (GOOGL, TSLA, and the software/discretionary funds IGV, XLY, XLC) against the geopolitics winners (USO, ITA, LMT, RTX). Anyone short single-stock volatility or long the index-vs-constituent correlation trade is the exposure most stretched by a 4.2% realized correlation print.
Initial jobless claims the BLS, released at 8:30 AM ET, fell 22,000 to 187,000 for the week ended July 18 — the lowest in over 50 years and well below the 212,000 consensus. The print reinforced a "low hire, low fire" labor market and, alongside the oil surge, pushed the 10-year yield toward 4.70% as traders added to bets on a Fed rate hike before year-end.
Variance decomposition: live intraday — 20260723 session, bracketed against its trailing-year range. Factor returns are trailing through last close. Total cross-sectional dispersion: 68%ile of the past year.
Variance mix — % of total, today vs 1d ago vs 1-yr avg
market 53%ile style 31%ile thematic 56%ile idiosyncratic 73%ile
Variance explained — today vs. factor's trailing-year range
Marker = the factor's share of today's total variance, placed in its own trailing-year range (box 25–75%ile, ticks 90%ile and max). Amber marker = unusually load-bearing today (≥90%ile of its own year). Factor name green = up today / red = down.
Correlation & dispersion — realized vs implied
Pairwise realized correlation (20d): 4.20% 0.2%ile
Top-500 pairwise: 5.88% 0.9%ile · implied (Cboe COR1M): 7.36 0.9%ile of its own history (gap -1.5pp)
Realized 20d vol (ann. pts): all stocks 46 vs VIXEQ 50 · index 8 vs VIX 19 · style factors 27 91.5%ile
20-day window (19 completed days + today); percentiles vs model history since 2020; definitions in Terms below. Implied prints (Cboe) are delayed ~15 min. as of 16:58 ET
High-beta momentum cohort (eq-wt, since-2020 rank): -0.3% 38%ile · rest of market -0.6%
| Factor | Today | 1d | 5d | 20d | 60d |
|---|---|---|---|---|---|
| Style-Risk | |||||
| Beta | -0.21% z-0.2 | -0.14% | -0.98% | -6.35% | +0.49% |
| Residual Volatility | -0.04% z-0.1 | -0.71% | -0.50% | -0.38% | -0.97% |
| International | -0.02% z-0.1 | +0.21% | +0.04% | +0.55% | -1.48% |
| Style | |||||
| Leverage | +0.26% z+1.4 | +0.43% | +0.36% | -0.99% | -0.11% |
| Growth | +0.23% z+0.9 | -0.18% | -0.36% | +1.33% | +1.81% |
| Profitability | +0.17% z+0.9 | +0.08% | +0.39% | -0.42% | -1.09% |
| Liquidity | -0.18% z-0.6 | +0.04% | +1.07% | -0.72% | -0.17% |
| Size | -0.19% z-0.5 | +0.18% | -0.36% | -0.19% | +0.64% |
| Dividend Yield | -0.09% z-0.5 | +0.18% | +0.81% | -0.47% | +1.08% |
| Value | +0.01% z+0.0 | +0.33% | +0.52% | -0.34% | -1.13% |
| Style-Momentum | |||||
| Medium-Term Momentum | -0.68% z-2.3 | -0.69% | -1.27% | -1.63% | +1.52% |
| Long-Term Momentum | +0.95% z+1.4 | +0.27% | +1.52% | -1.85% | +3.58% |
| Short-Term Momentum | +0.15% z+0.5 | -0.40% | -0.96% | -1.24% | -2.99% |
| One-Day Momentum | +0.00% z+0.0 | +0.27% | -0.57% | -0.85% | +1.04% |
| Style-Positioning | |||||
| Short Interest | -0.20% z-1.1 | -0.39% | -0.52% | +0.65% | +1.27% |
| Hedge-Fund Ownership | -0.01% z-0.1 | -0.21% | -0.49% | +0.72% | -0.87% |
| Style-Flow | |||||
| Short-Sale Activity | -0.22% z-1.9 | +0.06% | +0.07% | -0.09% | -0.11% |
| Morning Activity | -0.13% z-1.0 | -0.05% | -0.26% | -0.05% | -1.36% |
| Thematic | |||||
| Semiconductors | +0.99% z+1.7 | +0.62% | +1.90% | -2.09% | +0.94% |
| China | -0.58% z-1.4 | +0.39% | +0.30% | +0.33% | -4.65% |
| Bitcoin / Crypto | -0.24% z-0.8 | -0.28% | -0.10% | -0.54% | -0.76% |
| Treasury (Duration) | +0.21% z+0.6 | +0.69% | +0.90% | +1.11% | -0.18% |
| Oil | -0.05% z-0.1 | -0.12% | +0.67% | +0.57% | -0.11% |
| Gold | +0.01% z+0.0 | +0.53% | +0.67% | +0.49% | -3.31% |
Pairwise realized correlation. Index variance net of the weighted idiosyncratic diagonal, over the cross terms — the estimator used for implied-correlation indices. 20-day window unless noted; history since 2020.
Market variance share. The fraction of cross-sectional variance explained by the market factor — the attribution companion to pairwise correlation, not a substitute for it.
Factor z-score. Today's factor return divided by its daily-return standard deviation over ~1,600 trading days.
High-beta momentum cohort. US names above $2B market cap in the top quintile of both raw beta and 12-month momentum; membership frozen at each month's first business day. “Top 50” = the 50 strongest by combined rank.
Dispersion (realized). Total cross-sectional volatility net of the market component; high dispersion is the flip side of low correlation.
Stock-specific (idiosyncratic) return. The part of a stock's move not explained by market, style, or thematic factors in our decomposition.
VIXEQ / DSPX / COR1M. Cboe implied indices: single-stock volatility, dispersion, and 1-month implied correlation (top-50 S&P names). Quotes delayed ~15 minutes.
Data compiled by FactorPulse AI; edited and verified by Jeff Klein. For informational purposes only. Does not constitute financial advice, an investment recommendation, or an offer to buy or sell any securities. Always consult a qualified financial professional before making investment decisions.
For more on factor construction methodology, see www.factorpulse.com/glossary.