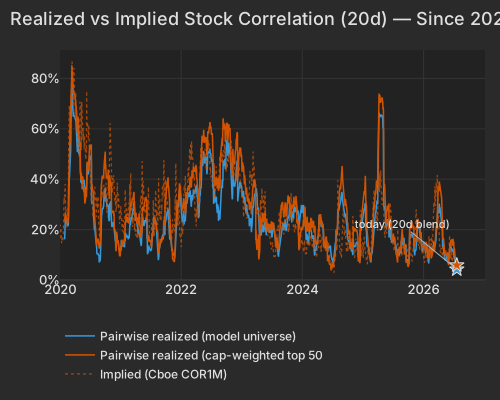
Every measure of how much stocks move together is pinned to the floor. Realized 20-day correlation across the broad universe is 4.24% (0.3 pctile since 2020); the large-cap like-for-like reads 5.87% (0.9 pctile); and the implied market has followed rather than led — COR1M at 4.30 and COR3M at 7.54 are each in the lowest fifth of a percentile of their two-decade ranges. This is not a one-day artifact of a thin pre-open session — it is a blended 20-day window, and the persistence is the point. Cboe's dispersion index (DSPX) is parked at 47.26, its 99.8th percentile, and single-stock implied volatility (VIXEQ) at 50.18 sits near the top of its history, even as index volatility (VIX) is a middling 18.92. Options desks are pricing the earnings calendar, not the macro direction. Financial Times
The consequence is a factor board with almost nothing on it. The largest style signals barely clear one standard deviation, and none carries a persistent multi-week trend.
| Factor | Return | Z-Score | 5d Z | 20d Z | 63d Z | Category | Direction |
|---|---|---|---|---|---|---|---|
| Short-Sale Activity | -0.13% | -1.17 | -1.11 | -0.63 | -0.47 | Style-Flow | Barely-shorted names beat most short-sold |
| Size | -0.43% | -1.12 | -0.54 | -0.18 | +0.27 | Style | Large-caps underperformed |
| Beta | -1.00% | -1.01 | +0.47 | -1.56 | -0.06 | Style-Risk | High-beta names underperformed |
| Growth | +0.21% | +0.83 | -0.2 | +1.1 | +1.0 | Style | Higher-growth names outperformed |
| Treasury (Duration) | +0.25% | +0.72 | +1.1 | +0.7 | -0.1 | Thematic | Long-duration names outperformed |
| Oil | +0.32% | +0.65 | +1.6 | +0.9 | -0.1 | Thematic | Oil-levered names outperformed |
| Semiconductors | +0.24% | +0.40 | +2.15 | -0.60 | +0.67 | Thematic | Higher-exposure names outperformed |
| Series | Today Pct | Prev Close Pct |
|---|---|---|
| pairwise_model | 4.24 | 3.93 |
| pairwise_top500 | 5.87 | 5.63 |
| implied_cor1m |
When the index does nothing, the story is told stock by stock, and today the catalysts are unrelated. Alphabet fell -5.34% and Tesla -8.07% after both raised AI capital-spending plans hard enough to alarm investors — Alphabet lifted full-year capex guidance to $195–205 billion and printed its first negative quarterly free cash flow in over a decade, overshadowing 82% Google Cloud growth. Bloomberg Financial Times Both moves are the stock's own: Tesla's idiosyncratic component was -5.11% (a -2.6 standard-deviation move against its own year), Alphabet's -3.21%, with the market and factor pieces almost incidental.
STMicroelectronics collapsed -17.81% on soft Q3 guidance despite a Q2 beat — the largest stock-specific drop in its trailing year (-6.0 sigma) — and dragged nothing broad with it: the Semiconductors factor is actually up (z=+0.4), and Texas Instruments' -5.21% was likewise its own valuation reset, not a sector signal. Bloomberg On the other side of the ledger, defense beats sent RTX +5.87% and Lockheed +5.06% on record backlogs, while a run of healthcare-services results carried Medpace +19.58%, Quest Diagnostics +8.30% and Thermo Fisher +6.43% — each a large stock-specific gain with little factor content.
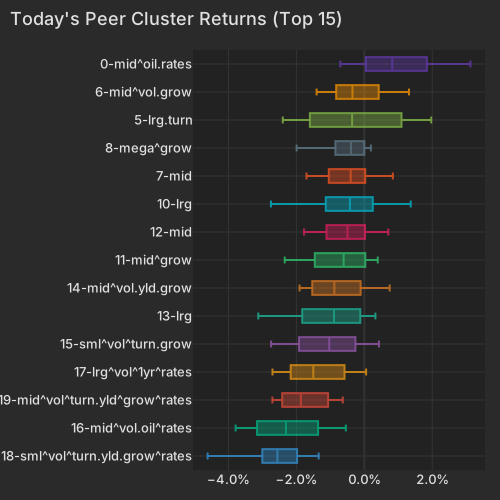
| Cluster | Median Ret Pct |
|---|---|
| 18-sml^vol^turn.yld.grow^rates | -2.56 |
| 16-mid^vol.oil^rates | -2.31 |
| 19-mid^vol^turn.yld^grow^rates | -1.87 |
| 17-lrg^vol^1yr^rates | -1.50 |
| 15-sml^vol^turn.grow | -1.03 |
| 13-lrg | -0.89 |
| 14-mid^vol.yld.grow | -0.88 |
| 11-mid^grow | -0.61 |
| 12-mid | -0.50 |
| 10-lrg | -0.42 |
| 7-mid | -0.40 |
| 8-mega^grow | -0.39 |
| 5-lrg.turn | -0.36 |
| 6-mid^vol.grow | -0.35 |
| 0-mid^oil.rates | 0.82 |
The ETF board shows the same fracture: a spread of nearly eleven points between the best and worst themes, with no single macro thread pulling them together.
| ETF | Theme | Today | 1d Ago | 5d Ago | 20d Ago | 63d Ago |
|---|---|---|---|---|---|---|
| USO | oil | +5.54% | +2.20% | +8.49% | +18.35% | +2.67% |
| XLE | energy | +1.77% | +1.20% | +4.78% | +8.70% | +5.96% |
| ITA | defense | +0.67% | +0.60% | -2.25% | -2.04% | +3.60% |
| XLV | healthcare | +0.16% | -0.51% | +0.72% | +4.76% | +9.26% |
| SPY | large cap | -1.03% | -0.12% | -0.98% | +1.89% | +6.15% |
| QQQ | large cap growth | -1.49% | -0.51% | -1.73% | -1.16% | +9.47% |
| SMH | semiconductors | -2.11% | +0.48% | -0.65% | -5.65% | +26.31% |
| XLY | consumer discretionary | -2.57% | -0.74% | -2.55% | +0.23% | -4.16% |
| GDX | gold miners | -3.13% | +3.36% | +3.62% | -1.26% | -17.54% |
| SLV | silver | -4.13% | +1.58% | +3.28% | -3.25% | -21.27% |
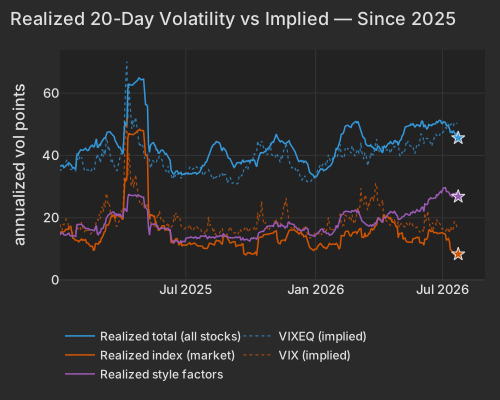
Here is what the Cboe prints alone cannot show a portfolio manager. Underneath the near-record-low index correlation, realized style volatility is running hot — 26.8 annualized vol points, its 91.5th percentile — while realized index volatility sits at 8.3 points, the 1.1 percentile. That gap is the whole regime: a factor rotation churning beneath a barely-moving index, with Beta (94.5th percentile of its variance share over the past 20 days) and Long-Term Momentum (94.1st) doing most of the work in the style block. The crowded high-beta momentum names, which had extreme sessions on July 21 and July 16, are the fault line that keeps style variance elevated even on a day their own factor moves are small.
| Series | Today Vol Pts | Prev Close Vol Pts |
|---|---|---|
| total | 45.60 | 46.23 |
| market | 8.30 | 8.24 |
| style | 26.80 | 27.11 |
The case against reading this as pure stock-picking is worth stating plainly: Size at z=-1.12 and Beta at z=-1.01 both leaned negative, and the mega-caps that fell hardest — Alphabet, Tesla — are precisely the long-duration names most exposed to a 10-year yield back at 4.71%. Some of what looks idiosyncratic may be a single rising-rate impulse hitting the largest, highest-beta names at the same moment. But the breadth argues otherwise: the barely-shorted cohort outperforming the most heavily short-sold names (Short-Sale Activity z=-1.17, the model's most statistically reliable effect and its durable baseline direction) is a market-internal flow, not a stress tell, and the enormous winners — Medpace, RTX, Quest — have nothing to do with duration.
The reason each name has its own catalyst is that several unrelated macro forces are live at once. Brent pushed toward $98 as Houthi militants struck two Saudi tankers in the Red Sea and US–Iran strikes widened, dashing near-term hopes of a deal. NYT Bloomberg That war premium sent USO +5.54% and lifted the energy complex, where the biggest movers are beta-carried E&P and refiner names (KOS, SM, PBF) rather than company-specific stories.
The same oil impulse is driving a global bond selloff. The 10-year Treasury yield is at 4.71%, up 5.2 bps on the session, with the 2-year at 4.36% and the 30-year above 5.19%. CNBC German 10-year yields hit a 15-year high ahead of the ECB, and money markets are now toying with a Fed hike into year-end. Financial Times Bloomberg A firmer dollar — DXY at 101.45, up +0.32% — is the other side of that, and it is punishing the metals even with oil surging: GLD -2.18%, SLV -4.13% and GDX -3.13% as the rebound in precious metals loses its footing. CNBC CNBC
For a risk book, the instruments to watch are the ones expressing the split rather than a direction: single-stock volatility (VIXEQ) and the dispersion index (DSPX) against a subdued VIX, the earnings names on both tails (GOOGL, TSLA, STM versus RTX, TMO, MEDP), and the energy/rates hedges (USO, XLE, TLT). Intel reports after the close and is the next single-name test of whether a strong print can still move on its own. Bloomberg
Initial jobless claims the BLS, released at 8:30 AM ET, fell 22,000 to 187,000 for the week ended July 18 — well below the 212,000 consensus and the lowest weekly reading in over fifty years, with continuing claims easing to 1.796 million. The print reinforced a tight, "low-hire, low-fire" labor market and added to the back-up in yields, with traders nudging up the odds of a Fed rate hike before year-end as the 10-year cleared 4.7%.
Variance decomposition: live intraday — 20260723 session, bracketed against its trailing-year range. Factor returns are trailing through last close. Total cross-sectional dispersion: 11%ile of the past year.
Variance mix — % of total, today vs 1d ago vs 1-yr avg
market 57%ile style 75%ile thematic 27%ile idiosyncratic 38%ile
Variance explained — today vs. factor's trailing-year range
Marker = the factor's share of today's total variance, placed in its own trailing-year range (box 25–75%ile, ticks 90%ile and max). Amber marker = unusually load-bearing today (≥90%ile of its own year). Factor name green = up today / red = down.
Correlation & dispersion — realized vs implied
Pairwise realized correlation (20d): 4.24% 0.3%ile
Top-500 pairwise: 5.87% 0.9%ile · implied (Cboe COR1M): 4.30 0.2%ile of its own history (gap +1.6pp)
Realized 20d vol (ann. pts): all stocks 46 vs VIXEQ 50 · index 8 vs VIX 19 · style factors 27 91.5%ile
20-day window (19 completed days + today); percentiles vs model history since 2020; definitions in Terms below. Implied prints (Cboe) are delayed ~15 min. as of 08:58 ET
High-beta momentum cohort (eq-wt, since-2020 rank): -1.3% 24%ile · rest of market -0.0%
| Factor | Today | 1d | 5d | 20d | 60d |
|---|---|---|---|---|---|
| Style-Risk | |||||
| Beta | -1.00% z-1.0 | -0.14% | -0.98% | -6.35% | +0.49% |
| International | -0.11% z-0.3 | +0.21% | +0.04% | +0.55% | -1.48% |
| Residual Volatility | +0.12% z+0.2 | -0.71% | -0.50% | -0.38% | -0.97% |
| Style | |||||
| Size | -0.43% z-1.1 | +0.18% | -0.36% | -0.19% | +0.64% |
| Growth | +0.21% z+0.8 | -0.18% | -0.36% | +1.33% | +1.81% |
| Dividend Yield | -0.07% z-0.4 | +0.18% | +0.81% | -0.47% | +1.08% |
| Profitability | +0.03% z+0.2 | +0.08% | +0.39% | -0.42% | -1.09% |
| Leverage | +0.02% z+0.1 | +0.43% | +0.36% | -0.99% | -0.11% |
| Liquidity | +0.03% z+0.1 | +0.04% | +1.07% | -0.72% | -0.17% |
| Value | +0.01% z+0.0 | +0.33% | +0.52% | -0.34% | -1.13% |
| Style-Momentum | |||||
| Long-Term Momentum | +0.37% z+0.6 | +0.27% | +1.52% | -1.85% | +3.58% |
| Short-Term Momentum | +0.12% z+0.4 | -0.40% | -0.96% | -1.24% | -2.99% |
| One-Day Momentum | +0.03% z+0.1 | +0.27% | -0.57% | -0.85% | +1.04% |
| Medium-Term Momentum | +0.02% z+0.1 | -0.69% | -1.27% | -1.63% | +1.52% |
| Style-Positioning | |||||
| Hedge-Fund Ownership | +0.07% z+0.6 | -0.21% | -0.49% | +0.72% | -0.87% |
| Short Interest | -0.01% z-0.1 | -0.39% | -0.52% | +0.65% | +1.27% |
| Style-Flow | |||||
| Short-Sale Activity | -0.13% z-1.2 | +0.06% | +0.07% | -0.09% | -0.11% |
| Morning Activity | -0.01% z-0.0 | -0.05% | -0.26% | -0.05% | -1.36% |
| Thematic | |||||
| Treasury (Duration) | +0.25% z+0.7 | +0.69% | +0.90% | +1.11% | -0.18% |
| China | -0.28% z-0.7 | +0.39% | +0.30% | +0.33% | -4.65% |
| Oil | +0.32% z+0.7 | -0.12% | +0.67% | +0.57% | -0.11% |
| Semiconductors | +0.24% z+0.4 | +0.62% | +1.90% | -2.09% | +0.94% |
| Gold | +0.03% z+0.1 | +0.53% | +0.67% | +0.49% | -3.31% |
| Bitcoin / Crypto | -0.02% z-0.1 | -0.28% | -0.10% | -0.54% | -0.76% |
Pairwise realized correlation. Index variance net of the weighted idiosyncratic diagonal, over the cross terms — the estimator used for implied-correlation indices. 20-day window unless noted; history since 2020.
Market variance share. The fraction of cross-sectional variance explained by the market factor — the attribution companion to pairwise correlation, not a substitute for it.
Factor z-score. Today's factor return divided by its daily-return standard deviation over ~1,600 trading days.
High-beta momentum cohort. US names above $2B market cap in the top quintile of both raw beta and 12-month momentum; membership frozen at each month's first business day. “Top 50” = the 50 strongest by combined rank.
Dispersion (realized). Total cross-sectional volatility net of the market component; high dispersion is the flip side of low correlation.
Stock-specific (idiosyncratic) return. The part of a stock's move not explained by market, style, or thematic factors in our decomposition.
VIXEQ / DSPX / COR1M. Cboe implied indices: single-stock volatility, dispersion, and 1-month implied correlation (top-50 S&P names). Quotes delayed ~15 minutes.
Data compiled by FactorPulse AI; edited and verified by Jeff Klein. For informational purposes only. Does not constitute financial advice, an investment recommendation, or an offer to buy or sell any securities. Always consult a qualified financial professional before making investment decisions.
For more on factor construction methodology, see www.factorpulse.com/glossary.