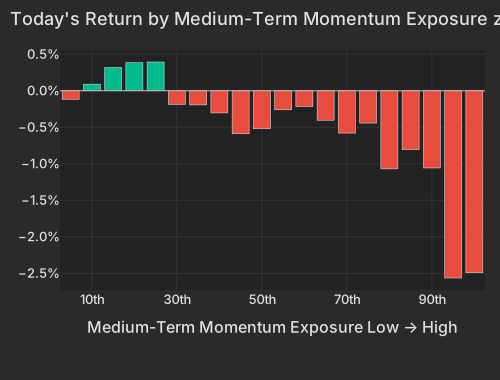
Strip out the flat headline and the cross-section is picking sides along the one-month momentum axis. Medium-Term Momentum — the factor that measures whether the past month's moves are continuing or reversing — printed z=-2.45 on a -0.72% return, its recent winners (the top-exposure bucket) falling roughly -2.46% as the month's laggards held. It was the day's top style-variance contributor at 5.2% (97.4th percentile since 2020). It shows cleanly across the ETF board: the recent leaders were sold — software (IGV -3.09%, up +5.17% over the prior 20 days), China internet (KWEB -2.09%), and ARK Innovation (ARKK -2.06%) — while the most beaten-down groups caught a bid, semiconductors (SMH +1.02%) and gold miners among them. Beta itself was inert (z=0.06), so this is the momentum axis specifically, not a broad reduction in risk.
The reversal is fresh rather than structural: the five-day reading (z=-1.98) shows it built over the past week, but the 63-day is still mildly positive (z=+0.80), so today is an acceleration, not a months-long trend — the last comparable momentum reversal was July 1. The timing is not accidental. Alphabet reports after the close tonight, with options pricing an implied swing of roughly 5.4%, Bloomberg and the highest-multiple growth names are being trimmed into it — ServiceNow (NOW -6.09%) and the broader software complex led it. Treasury Secretary Bessent's threat to sanction users of Chinese AI models adds another weight to the megacap-growth side of the book. Bloomberg
| Factor | Return | Z-Score | 5d Z | 20d Z | 63d Z | Category | Direction |
|---|---|---|---|---|---|---|---|
| Medium-Term Momentum | -0.72% | -2.45 | -1.98 | -1.27 | +0.80 | Style-Momentum | Down |
| Leverage | +0.44% | +2.36 | +0.87 | -1.17 | -0.14 | Style | Up |
| Short Interest | -0.37% | -2.12 | -1.29 | +0.83 | +0.59 | Style-Positioning | Down |
| Treasury (Duration) | +0.67% | +1.93 | +1.14 | +0.70 | -0.22 | Thematic | Up |
| Gold | +0.46% | +1.39 | +0.82 | +0.28 | -1.41 | Thematic | Up |
| Residual Volatility | -0.60% | -1.18 | -0.35 | -0.12 | -0.35 | Style-Risk | Down |
| Bucket | Avg Ret Pct |
|---|---|
| 1 | -0.12 |
| 2 | 0.09 |
| 3 | 0.32 |
| 4 | 0.38 |
| 5 | 0.39 |
| 6 | -0.19 |
| 7 | -0.19 |
| 8 | -0.30 |
| 9 | -0.59 |
| 10 | -0.52 |
| 11 | -0.26 |
| 12 | -0.22 |
| 13 | -0.40 |
| 14 | -0.58 |
| 15 | -0.44 |
| 16 | -1.07 |
| 17 | -0.80 |
| 18 | -1.06 |
| 19 | -2.56 |
| 20 | -2.49 |
The bid had somewhere to go, and it was defensive and hard-asset. The Treasury duration factor rose +0.67% (z=+1.9) — its strongest reading by direction since November 2022 — as duration-sensitive equities led, utilities the clearest expression (XLU +1.99%, Constellation Energy CEG +4.71%). Here is the nuance our lens adds: this happened while the 10-year Treasury yield rose to 4.665%, up 3.7 bps on the day, CNBC and TLT fell -0.31% — the strength is in equity selection, not in bonds rallying, so a book hedged through rate duration took nothing from it. Gold did similar work (z=+1.4), miners outrunning bullion (GDX +2.99%, SLV +1.87%, GLD +1.15%) with a softer dollar behind it (DXY at 101.12, -0.05%). CNBC Oil above $95 after Iran ruled out fresh talks lifted energy (XLE +1.32%, Equinor EQNR +6.20% on its results), Bloomberg though the residualized Oil factor was flat (z=-0.02) — that move sits in the crude names, not the factor. Leverage was the other statistically strong reading (z=+2.36), and higher-volatility names lagged (Residual Volatility z=-1.18), both consistent with the day's defensive lean.
| ETF | Theme | Today | 5d | 20d | 63d |
|---|---|---|---|---|---|
| GDX | gold miners | +2.99% | -0.92% | -8.90% | -25.16% |
| USO | oil | +2.85% | +7.22% | +14.34% | +6.21% |
| XLU | utilities | +1.99% | -1.69% | +0.45% | -1.81% |
| XLE | energy | +1.32% | +2.72% | +8.21% | +6.23% |
| SMH | semiconductors | +1.02% | -2.70% | -12.68% | +25.89% |
| EWY | south korea | -1.44% | -2.31% | -21.06% | +15.20% |
| ARKK | innovation growth | -2.06% | -2.30% | -0.94% | -2.05% |
| KWEB | china internet | -2.09% | +3.21% | +7.86% | -10.80% |
| IGV | software | -3.09% | -1.93% | +5.17% | +6.40% |
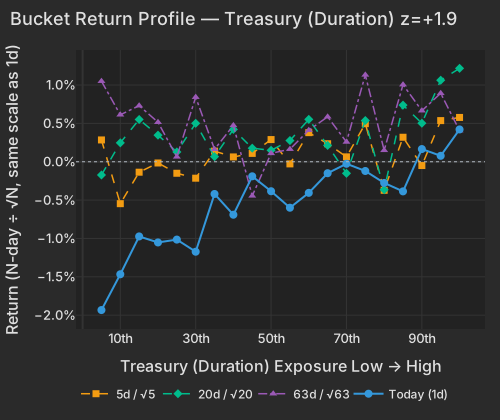
| Bucket | Ret 1D Pct | Ret 5D Norm Pct | Ret 20D Norm Pct | Ret 63D Norm Pct |
|---|---|---|---|---|
| 1 | -1.93 | 0.28 | -0.17 | 1.05 |
| 2 | -1.47 | -0.55 | 0.25 | 0.61 |
| 3 | -0.97 | -0.14 | 0.55 | 0.73 |
| 4 | -1.05 | -0.02 | 0.35 | 0.51 |
| 5 | -1.01 | -0.15 | 0.13 | 0.06 |
| 6 | -1.17 | -0.21 | 0.50 | 0.84 |
| 7 | -0.42 | 0.14 | 0.07 | 0.16 |
| 8 | -0.69 | 0.06 | 0.42 | 0.47 |
| 9 | -0.19 | 0.11 | 0.18 | -0.44 |
| 10 | -0.38 | 0.29 | 0.15 | 0.11 |
| 11 | -0.60 | -0.03 | 0.28 | 0.16 |
| 12 | -0.41 | 0.38 | 0.55 | 0.41 |
| 13 | -0.15 | 0.23 | 0.21 | 0.59 |
| 14 | -0.03 | 0.06 | -0.15 | 0.26 |
| 15 | -0.12 | 0.50 | 0.54 | 1.13 |
| 16 | -0.28 | -0.37 | -0.36 | 0.15 |
| 17 | -0.39 | 0.32 | 0.74 | 1.00 |
| 18 | 0.17 | -0.05 | 0.50 | 0.67 |
| 19 | 0.08 | 0.54 | 1.06 | 0.89 |
| 20 | 0.42 | 0.58 | 1.22 | 0.41 |
None of this shows up at the index level, and that is the point for anyone hedged on beta. Realized 20-day pairwise correlation is 3.96%, the 0.1 percentile since 2020, because the market leg is nearly inert — it explains just 3.2% of 20-day cross-sectional variance against a style share of 34.4% (92nd percentile). The options market agrees the churn is here to stay: implied 1-month single-stock correlation (Cboe COR1M) sits at 4.58, the lowest ~0.2% of its 20-year history, and implied dispersion (Cboe DSPX) is at its 99.8th percentile. The single-name moves that fill that variance are extreme: Pegasystems (PEGA -17.49%) cratered on a soft outlook and a downgrade, almost entirely its own move, MarketWatch while Arrowhead (ARWR +20.63%) and Wabtec (WAB +10.00%) ran on their own stories. AT&T (T +2.36%) beat and outperformed as a defensive, MarketWatch and Chubb (CB -3.67%) fell on a revenue miss. Bloomberg Abroad, Korea's KOSPI whipsawed, jumping as much as 6.2% intraday before closing up 0.74%, with EWY -1.44% here. Economic Times
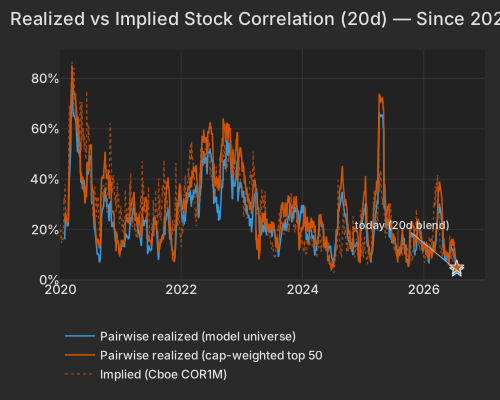
| Series | Today Pct | Prev Close Pct |
|---|---|---|
| pairwise_model | 3.96 | 4.20 |
| pairwise_top500 | 4.98 | 5.93 |
| implied_cor1m |
It all lives inside the cross-section, which is the reason to be careful with the story. The index is flat, Beta is dormant, and the most heavily shorted names simply kept underperforming the un-shorted (Short Interest z=-2.12) with no squeeze — the model's most persistent drag still working. Even yesterday's pressure point has eased: the crowded high-beta momentum cohort was essentially flat, its top-50 slice at -0.18% and the broader group +0.12%, so the selling has narrowed to the momentum-reversal axis rather than the beta complex. Read plainly, this looks like orderly profit-taking into a marquee earnings print, not forced de-risking — and a strong Alphabet number tonight could hand the winners right back. Bloomberg
Variance decomposition: live intraday — 20260722 session, bracketed against its trailing-year range. Factor returns are trailing through last close. Total cross-sectional dispersion: 27%ile of the past year.
Variance mix — % of total, today vs 1d ago vs 1-yr avg
market 22%ile style 70%ile thematic 96.0%ile idiosyncratic 43%ile
Variance explained — today vs. factor's trailing-year range
Marker = the factor's share of today's total variance, placed in its own trailing-year range (box 25–75%ile, ticks 90%ile and max). Amber marker = unusually load-bearing today (≥90%ile of its own year). Factor name green = up today / red = down.
Correlation & dispersion — realized vs implied
Pairwise realized correlation (20d): 3.96% 0.1%ile
Top-500 pairwise: 4.98% 0.1%ile · implied (Cboe COR1M): 4.58 0.2%ile of its own history (gap +0.4pp)
Realized 20d vol (ann. pts): all stocks 46 vs VIXEQ 50 · index 8 vs VIX 17 · style factors 27 92.2%ile
20-day window (19 completed days + today); percentiles vs model history since 2020; definitions in Terms below. Implied prints (Cboe) are delayed ~15 min. as of 15:21 ET
Top 50 high-beta momentum names (eq-wt, since-2020 rank): -0.2% 43%ile · rest of market -0.4%
| Factor | Today | 1d | 5d | 20d | 60d |
|---|---|---|---|---|---|
| Style-Risk | |||||
| Residual Volatility | -0.60% z-1.2 | +0.33% | -0.31% | +0.07% | -0.08% |
| International | +0.22% z+0.7 | +0.15% | +0.16% | +0.04% | -1.36% |
| Beta | +0.06% z+0.1 | +2.52% | -1.26% | -9.04% | +1.71% |
| Style | |||||
| Leverage | +0.44% z+2.4 | +0.18% | -0.01% | -1.29% | -0.86% |
| Value | +0.30% z+1.2 | +0.02% | +0.21% | -0.69% | -1.35% |
| Dividend Yield | +0.21% z+1.1 | +0.38% | +0.39% | -0.71% | +0.90% |
| Growth | -0.18% z-0.7 | -0.20% | -0.20% | +1.54% | +2.22% |
| Size | +0.27% z+0.7 | -0.13% | -0.48% | -0.89% | +0.83% |
| Profitability | +0.07% z+0.3 | +0.01% | +0.16% | -1.03% | -1.08% |
| Liquidity | +0.01% z+0.0 | +0.71% | +0.77% | -0.79% | -0.17% |
| Style-Momentum | |||||
| Medium-Term Momentum | -0.72% z-2.5 | -0.84% | -0.38% | -0.95% | +2.75% |
| Short-Term Momentum | -0.40% z-1.2 | -0.41% | -0.71% | -1.06% | -2.54% |
| One-Day Momentum | +0.22% z+0.8 | -0.24% | -1.23% | -1.70% | +0.61% |
| Long-Term Momentum | +0.47% z+0.7 | +1.68% | +0.02% | -3.24% | +3.43% |
| Style-Positioning | |||||
| Short Interest | -0.37% z-2.1 | -0.20% | +0.01% | +1.15% | +1.63% |
| Hedge-Fund Ownership | -0.17% z-1.5 | -0.13% | -0.01% | +1.00% | -0.59% |
| Style-Flow | |||||
| Short-Sale Activity | +0.05% z+0.5 | -0.11% | +0.03% | -0.23% | -0.18% |
| Morning Activity | -0.04% z-0.3 | +0.12% | +0.01% | -0.05% | -1.55% |
| Thematic | |||||
| Treasury (Duration) | +0.67% z+1.9 | +0.15% | +0.33% | +0.53% | -0.89% |
| Gold | +0.46% z+1.4 | +0.22% | +0.14% | -0.23% | -4.52% |
| Semiconductors | +0.75% z+1.3 | +1.42% | -0.03% | -4.35% | +0.88% |
| China | +0.35% z+0.8 | -0.13% | +0.28% | +0.02% | -4.72% |
| Bitcoin / Crypto | -0.25% z-0.8 | +0.35% | -0.04% | -0.35% | -0.36% |
| Oil | -0.01% z-0.0 | +0.45% | +0.13% | +0.34% | -0.02% |
Pairwise realized correlation. Index variance net of the weighted idiosyncratic diagonal, over the cross terms — the estimator used for implied-correlation indices. 20-day window unless noted; history since 2020.
Factor z-score. Today's factor return divided by its daily-return standard deviation over ~1,600 trading days.
High-beta momentum cohort. US names above $2B market cap in the top quintile of both raw beta and 12-month momentum; membership frozen at each month's first business day. “Top 50” = the 50 strongest by combined rank.
Dispersion (realized). Total cross-sectional volatility net of the market component; high dispersion is the flip side of low correlation.
VIXEQ / DSPX / COR1M. Cboe implied indices: single-stock volatility, dispersion, and 1-month implied correlation (top-50 S&P names). Quotes delayed ~15 minutes.
Data compiled by FactorPulse AI; edited and verified by Jeff Klein. For informational purposes only. Does not constitute financial advice, an investment recommendation, or an offer to buy or sell any securities. Always consult a qualified financial professional before making investment decisions.
For more on factor construction methodology, see www.factorpulse.com/glossary.