Treasury Secretary Scott Bessent signaled the US could sanction Chinese firms for intellectual-property theft used to train frontier AI models, shifting the export-control fight from hardware toward the software layer.Bloomberg Memory — where capacity across Samsung, SK Hynix and Micron is fully committed through 2026 and contract DRAM prices are set to rise about 21% next quarter — was the sharpest expression.FT Micron jumped +12.89%, adding roughly $128 billion in market value, alongside SanDisk at +15.87%; the rebound rippled across the mainland chip complex that had rallied overnight.Economic Times The Semiconductors factor rose +1.47% (z=+2.46).
| Factor | Return | Z-Score | 5d Z | 20d Z | 63d Z | Category | Direction |
|---|---|---|---|---|---|---|---|
| Liquidity | +0.86% | z=+2.95 | +1.4 | -0.5 | 0.0 | Style | High-turnover names led |
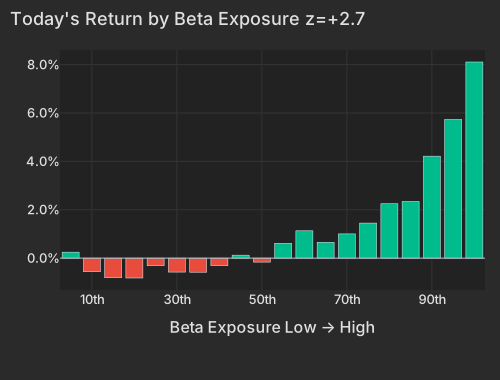
| Beta | +2.65% | z=+2.69 | -0.5 | -2.0 | +0.1 | Style-Risk | High-beta names led |
| Long-Term Momentum | +1.68% | z=+2.58 | 0.0 | -1.1 | +1.0 | Style-Momentum | 1-yr winners led |
| Semiconductors | +1.47% | z=+2.46 | 0.0 | -1.6 | +0.6 | Thematic | Chip names led |
| Medium-Term Momentum | -0.86% | z=-2.93 | -0.6 | -0.8 | +1.1 | Style-Momentum | 1-mo losers led |
| Short-Term Momentum | -0.50% | z=-1.47 | -1.1 | -0.8 | -1.0 | Style-Momentum | Recent losers led |
The mechanism is cleaner in the factor tape than in the headlines. Beta was the largest style force of the day at +2.65% (z=+2.69), and its 20-day z of -2.0 — with the high-beta cross-section down -8.91% over that window — marks today as a reversal of a multi-week sell-off, not a fresh trend. Crucially, Micron's move was carried by that beta complex, not its own story: its style component ran +9.9% against an idiosyncratic contribution near +1.2%, and SanDisk's rebound was almost entirely factor-driven. Liquidity at z=+2.95 points the same way — the highest-turnover, most-optioned names led, the fingerprint of hedging flow into the highest-beta expressions rather than a fundamental repricing.
| Bucket | Avg Ret Pct |
|---|---|
| 1 | 0.25 |
| 2 | -0.56 |
| 3 | -0.81 |
| 4 | -0.82 |
| 5 | -0.31 |
| 6 | -0.58 |
| 7 | -0.58 |
| 8 | -0.31 |
| 9 | 0.12 |
| 10 | -0.16 |
| 11 | 0.61 |
| 12 | 1.13 |
| 13 | 0.66 |
| 14 | 1.00 |
| 15 | 1.45 |
| 16 | 2.25 |
| 17 | 2.34 |
| 18 | 4.21 |
| 19 | 5.73 |
| 20 | 8.11 |
This is best read through the group the desk has been watching all month. The top-50 high-beta momentum names rose +9.99% — a 5th-best day since 2020 — and the broader ~190-name basket added +6.37%, its 13th-best. Both came off a punishing drawdown: the tighter group had been down about 30% from its high, with its most recent extreme session only last Thursday. And today's gain was rank-ordered in the characteristic itself — the amplification between the two baskets ran 1.57 versus a normal 1.14, meaning the more precisely a name fit the high-beta-and-momentum profile, the harder it rose. That is a systematic re-risking signature, and it stands in stark relief against the flat -0.13% for everything outside the group.
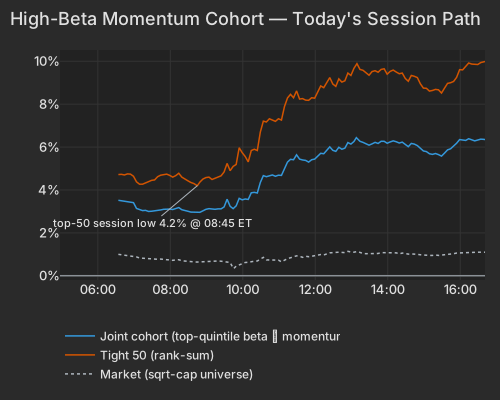
| Series | Ret Pct |
|---|---|
| joint | 6.37 |
| tight50 | 9.99 |
| market | 1.10 |
| rest | -0.13 |
The momentum axis has been July's fault line — the month's -1.47%-per-sigma Long-Term Momentum drop on July 1 was the sharpest of the recent run — and today the same axis snapped the other way, with Long-Term Momentum posting a +1.19%-per-sigma move at its 99.5th percentile since 2020. One-year winners led (Long-Term Momentum z=+2.58) even as the past month's winners gave back to the month's losers (Medium-Term Momentum z=-2.93) — consistent with beaten-down long-term leaders rebounding hardest.
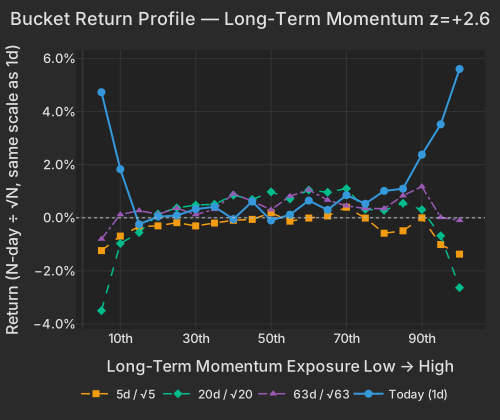
| Bucket | Ret 1D Pct | Ret 5D Norm Pct | Ret 20D Norm Pct | Ret 63D Norm Pct |
|---|---|---|---|---|
| 1 | 4.73 | -1.24 | -3.50 | -0.80 |
| 2 | 1.83 | -0.69 | -0.97 | 0.12 |
| 3 | -0.25 | -0.33 | -0.56 | 0.27 |
| 4 | 0.04 | -0.30 | 0.14 | 0.13 |
| 5 | 0.09 | -0.18 | 0.37 | 0.36 |
| 6 | 0.33 | -0.31 | 0.48 | 0.12 |
| 7 | 0.41 | -0.20 | 0.51 | 0.32 |
| 8 | -0.05 | -0.09 | 0.85 | 0.90 |
| 9 | 0.61 | -0.06 | 0.69 | 0.63 |
| 10 | -0.10 | 0.19 | 0.98 | 0.30 |
| 11 | 0.12 | -0.13 | 0.71 | 0.81 |
| 12 | 0.65 | -0.01 | 1.04 | 1.05 |
| 13 | 0.30 | 0.07 | 0.96 | 0.66 |
| 14 | 0.85 | 0.40 | 1.10 | 0.45 |
| 15 | 0.53 | -0.01 | 0.32 | 0.35 |
| 16 | 1.01 | -0.58 | 0.28 | 0.35 |
| 17 | 1.09 | -0.49 | 0.54 | 0.83 |
| 18 | 2.38 | -0.00 | 0.31 | 1.18 |
| 19 | 3.52 | -1.01 | -0.68 | 0.01 |
| 20 | 5.61 | -1.37 | -2.63 | -0.10 |
Here is what a quote screen misses: none of this touched the index. Realized pairwise correlation — the desk-standard estimator — sits at just 4.11% over the blended 20-day window, the 0.1th percentile since 2020 and a near-record low, with the large-cap like-for-like at 5.39% (0.4th percentile). The market factor explained only 3.4% of cross-sectional variance (1.7th percentile) while the style block churned at 28.3 vol points (95.5th percentile), led by beta and long-term momentum. In plain terms, a furious factor rotation is running underneath a placid tape — the VIX actually fell to 17.05. The options market agrees: implied one-month single-stock correlation (Cboe COR1M) collapsed to 4.98, the lowest roughly 0.3% of its 20-year history. That is the proprietary read: the day's action was a rank-ordered move within one crowded characteristic, not a directional bid on equities.
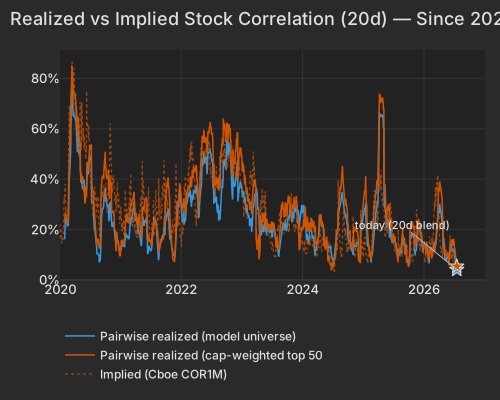
| Series | Today Pct | Prev Close Pct |
|---|---|---|
| pairwise_model | 4.11 | 3.36 |
| pairwise_top500 | 5.39 | 5.72 |
| implied_cor1m |
The ETF cross-section maps the same divergence. What snapped back today is precisely what had been crushed over 20 days; what held up over 20 days lagged today.
| ETF | Theme | Today | 1d Ago | 5d Ago | 20d Ago | 63d Ago |
|---|---|---|---|---|---|---|
| DRAM | memory chips | +12.00% | +0.64% | -7.40% | -30.83% | +49.09% |
| EWY | south korea | +6.89% | +0.20% | -3.07% | -25.70% | +6.91% |
| GDX | gold miners | +4.88% | -0.81% | -3.58% | -14.26% | -29.50% |
| SMH | semiconductors | +4.49% | +0.41% | -4.57% | -15.31% | +20.40% |
| MTUM | momentum | +3.91% | +0.18% | -3.81% | -10.60% | +10.27% |
| USO | oil | +2.52% | +1.25% | +6.55% | +9.26% | +8.16% |
| SPY | large cap | +0.79% | -0.16% | -0.95% | -0.62% | +4.50% |
| IGV | software | -1.58% | +0.19% | +0.30% | +4.37% | +9.29% |
| IWD | value | -1.20% | -0.43% | -0.27% | +1.97% | +8.72% |
The case for a durable bottom is that momentum snapbacks of this size have historically led somewhere, and the memory supply story is genuinely structural. But the evidence for a mechanical bounce is stronger here: breadth was flat, correlation is at a floor, and the memory leaders' gains were factor-carried rather than name-specific. Long-Term Momentum's own construction is a warning — it is a left-skewed premium prone to sharp two-way whipsaws around exactly this kind of session, so a large up-day off a crash is as much a feature of the crash regime as a break from it.
Underneath the factor churn, the day's real conviction moves were idiosyncratic and mostly to the downside. MSCI fell -10.36% on a Q2 miss and higher full-year expense guidance,the SEC and Danaher dropped -11.10% — its largest stock-specific move in its trailing year — after trimming its core revenue outlook despite a headline beat.Bloomberg Pegasystems slid -14.03% on its own soft quarter. On the other side, 3M was the standout gainer at +7.23% after a beat-and-raise, a move almost entirely its own.Bloomberg DTE Energy fell -6.56%, also stock-specific, as its data-center growth narrative met Michigan regulatory pushback.
The macro undercurrent is energy. Brent settled near $91 after a tenth night of US strikes on Iran and reported attacks on shipping near the Strait of Hormuz,Bloomberg with Houthi threats of a Saudi maritime blockade keeping a bid under crude.NYT USO rose +2.52% and energy was the day's third-best sector at +1.99% (median stock). Gold miners joined the high-beta bid — GDX +4.88% despite a firmer dollar (DXY +0.24% to 101.19) — another beaten-down, high-beta group snapping back rather than a clean macro signal.
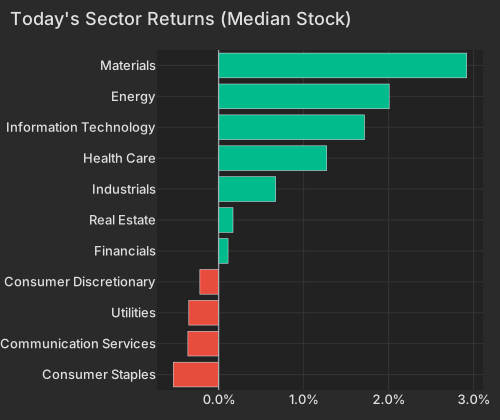
| Sector | Median Ret Pct |
|---|---|
| Consumer Staples | -0.53 |
| Communication Services | -0.36 |
| Utilities | -0.35 |
| Consumer Discretionary | -0.22 |
| Financials | 0.11 |
| Real Estate | 0.17 |
| Industrials | 0.67 |
| Health Care | 1.27 |
| Information Technology | 1.72 |
| Energy | 2.01 |
| Materials | 2.92 |
The names to check are the high-beta memory and AI-semis complex — MU, SanDisk, AMD, TSM against SMH, DRAM and MTUM — where positioning risk now runs both ways after a 5th-best-since-2020 session off a 30% drawdown. The correlation floor is the second book to mind: with realized and implied single-stock correlation both near record lows, index hedges are cheap relative to the single-name churn, and any move back toward the crowded longs would show up first in MTUM and the highest-beta buckets. Software (IGV) and value (IWD) are the funding legs that sat out today's rotation.
The ADP adpemploymentreport.com Employment Change, released at 8:15 AM ET, showed private employers adding an average of 16,500 jobs per week over the four weeks to July 4 — a fourth straight week of cooling from the prior 19,250 pace, which ADP attributed to longer job searches and labor-supply constraints. The Philadelphia Fed Non-Manufacturing Survey, released at 8:30 AM ET, jumped 33.2 points to a reading of 7.4 — its first positive regional services print since October 2024 — though prices-paid stayed elevated at 28.2, keeping the sticky-inflation watch alive.
Variance decomposition: live intraday — 20260721 session, bracketed against its trailing-year range. Factor returns are trailing through last close. Total cross-sectional dispersion: 90.8%ile of the past year.
Variance mix — % of total, today vs 1d ago vs 1-yr avg
market 65%ile style 99.6%ile thematic 19%ile idiosyncratic 2.4%ile
Variance explained — today vs. factor's trailing-year range
Marker = the factor's share of today's total variance, placed in its own trailing-year range (box 25–75%ile, ticks 90%ile and max). Amber marker = unusually load-bearing today (≥90%ile of its own year). Factor name green = up today / red = down.
Correlation & dispersion — realized vs implied
Pairwise realized correlation (20d): 4.11% 0.1%ile
Top-500 pairwise: 5.39% 0.4%ile · implied (Cboe COR1M): 4.98 0.3%ile of its own history (gap +0.4pp)
Realized 20d vol (ann. pts): all stocks 47 vs VIXEQ 50 · index 9 vs VIX 17 · style factors 28 95.5%ile
20-day window (19 completed days + today); percentiles vs model history since 2020; definitions in Terms below. Implied prints (Cboe) are delayed ~15 min. as of 16:41 ET
Top 50 high-beta momentum names (eq-wt, since-2020 rank): +10.0% 99.8%ile · rest of market -0.1%
| Factor | Today | 1d | 5d | 20d | 60d |
|---|---|---|---|---|---|
| Style-Risk | |||||
| Beta | +2.65% z+2.7 | +0.12% | -2.41% | -11.30% | -1.82% |
| Residual Volatility | +0.40% z+0.8 | +0.46% | -0.82% | -0.76% | -1.77% |
| International | +0.18% z+0.6 | -0.04% | -0.04% | -0.06% | -1.74% |
| Style | |||||
| Liquidity | +0.86% z+3.0 | +0.77% | +0.03% | -1.88% | -1.46% |
| Dividend Yield | +0.40% z+2.2 | +0.01% | +0.27% | -0.84% | +0.79% |
| Leverage | +0.27% z+1.4 | -0.17% | -0.27% | -1.54% | -0.61% |
| Growth | -0.17% z-0.7 | +0.13% | +0.19% | +1.65% | +2.08% |
| Size | -0.12% z-0.3 | +0.18% | -0.34% | -0.85% | +1.19% |
| Value | +0.06% z+0.2 | +0.01% | -0.00% | -0.93% | -1.05% |
| Profitability | -0.02% z-0.1 | +0.03% | -0.02% | -1.07% | -0.99% |
| Style-Momentum | |||||
| Medium-Term Momentum | -0.86% z-2.9 | -0.13% | +0.31% | -0.19% | +3.47% |
| Long-Term Momentum | +1.68% z+2.6 | -0.07% | -1.00% | -3.16% | +2.66% |
| Short-Term Momentum | -0.50% z-1.5 | -0.14% | -0.23% | -0.65% | -1.99% |
| One-Day Momentum | -0.29% z-1.0 | -0.27% | -1.04% | -1.40% | +0.90% |
| Style-Positioning | |||||
| Short Interest | -0.25% z-1.4 | -0.26% | -0.05% | +1.33% | +1.51% |
| Hedge-Fund Ownership | -0.14% z-1.3 | -0.04% | +0.15% | +1.12% | -0.75% |
| Style-Flow | |||||
| Morning Activity | +0.13% z+1.0 | +0.00% | -0.17% | -0.10% | -1.76% |
| Short-Sale Activity | -0.10% z-0.9 | -0.06% | +0.02% | -0.13% | -0.24% |
| Thematic | |||||
| Semiconductors | +1.47% z+2.5 | +0.17% | -0.99% | -4.49% | +0.91% |
| Bitcoin / Crypto | +0.30% z+1.0 | +0.30% | -0.19% | -0.79% | -1.60% |
| Oil | +0.45% z+0.9 | +0.51% | -0.07% | +0.07% | -1.13% |
| Gold | +0.19% z+0.6 | +0.13% | +0.01% | -0.76% | -4.57% |
| Treasury (Duration) | +0.16% z+0.5 | -0.41% | +0.30% | +0.44% | -1.23% |
| China | -0.13% z-0.3 | +0.30% | +0.39% | +0.20% | -4.92% |
Pairwise realized correlation. Index variance net of the weighted idiosyncratic diagonal, over the cross terms — the estimator used for implied-correlation indices. 20-day window unless noted; history since 2020.
Market variance share. The fraction of cross-sectional variance explained by the market factor — the attribution companion to pairwise correlation, not a substitute for it.
Factor z-score. Today's factor return divided by its daily-return standard deviation over ~1,600 trading days.
High-beta momentum cohort. US names above $2B market cap in the top quintile of both raw beta and 12-month momentum; membership frozen at each month's first business day. “Top 50” = the 50 strongest by combined rank.
Stock-specific (idiosyncratic) return. The part of a stock's move not explained by market, style, or thematic factors in our decomposition.
VIXEQ / DSPX / COR1M. Cboe implied indices: single-stock volatility, dispersion, and 1-month implied correlation (top-50 S&P names). Quotes delayed ~15 minutes.
Data compiled by FactorPulse AI; edited and verified by Jeff Klein. For informational purposes only. Does not constitute financial advice, an investment recommendation, or an offer to buy or sell any securities. Always consult a qualified financial professional before making investment decisions.
For more on factor construction methodology, see www.factorpulse.com/glossary.