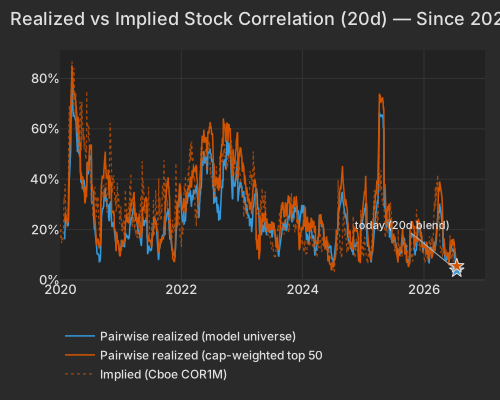
Underneath a calm index, the cross-section is being pulled apart along the style axes. On the blended 20-day window, the market explains only 3.1% of variance (0.1st percentile since 2020) while the style block runs at 27.2 vol points, its 92.6th percentile. Beta does most of the work at 21% of total variance, with Long-Term Momentum second. That combination — a near-motionless index and a hyperactive style complex — is what pins realized correlation at 3.8% (pairwise) and 5.6% on the large-cap-comparable series, the like-for-like against implied. Implied single-stock correlation (Cboe COR1M) sits at 6.81, its own 0.7th percentile over twenty years, so forward correlation carries a modest premium to what has actually printed.
| Factor | Return | Z-Score | 5d Z | 20d Z | 63d Z | Category | Direction |
|---|---|---|---|---|---|---|---|
| Beta | +1.33% | z=1.4 | -1.1 | -2.3 | 0.0 | Style-Risk | High-beta names outperformed |
| Semiconductors | +0.93% | z=1.6 | -0.4 | -1.8 | 0.5 | Thematic | High-exposure names outperformed |
| Dividend Yield | +0.29% | z=1.5 | 0.7 | -1.0 | 0.9 | Style | Higher-payout names outperformed |
| Long-Term Momentum | +0.71% | z=1.1 | -0.7 | -1.4 | 0.8 | Style-Momentum | 1-year winners outperformed |
| Medium-Term Momentum | -0.48% | z=-1.6 | 0.0 | -0.5 | 1.3 | Style-Momentum | Past-month winners gave back |
| Hedge-Fund Ownership | -0.12% | z=-1.1 | 0.1 | 0.5 | -0.4 | Style-Positioning | HF-favored names lagged |
| Series | Today Pct | Prev Close Pct |
|---|---|---|
| pairwise_model | 3.83 | 3.36 |
| pairwise_top500 | 5.56 | 5.72 |
| implied_cor1m |
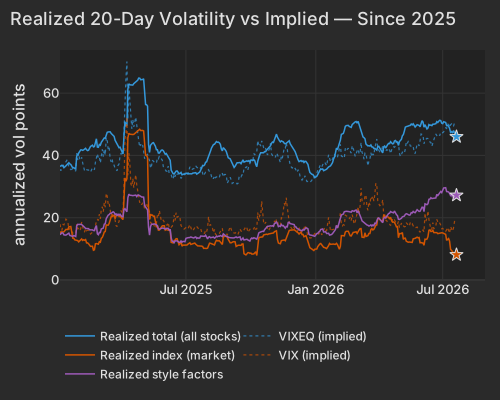
The volatility levels sharpen the picture. Blended realized style volatility is running at 27.2 points against a market leg of just 8.1 points (0.8th percentile), and the implied prints echo it: single-stock implied vol (Cboe VIXEQ) is elevated at 50.67 while index implied vol (Cboe VIX) has eased to 17.84, down from 18.65. Names are moving hard; the index they belong to is not.
| Series | Today Vol Pts | Prev Close Vol Pts |
|---|---|---|
| total | 46.00 | 46.76 |
| market | 8.10 | 7.86 |
| style | 27.20 | 27.10 |
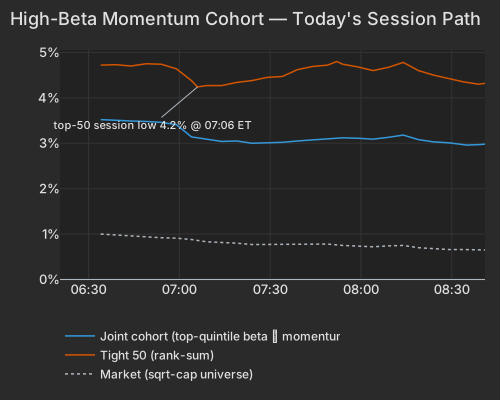
The same beta-and-momentum churn has a name: the crowded high-beta momentum cohort, beaten down through last week, is snapping back. The top-50 high-beta momentum names are up +4.31% — a 98th-best session out of 1,644 since 2020 — while the broader ~180-name version rose +2.98% and sat roughly 20% below its high going in. The rest of the market is flat at -0.01%. This morning's move was rank-ordered along the beta-momentum characteristic itself: the group moved 1.45× the broader high-beta basket versus a 1.14× norm, so the more a name fit the profile, the harder it rose. The context that matters for risk books is the 20-day beta signal at z=-2.3 — high-beta names had underperformed low-beta by more than 10% into today — which frames this as a bounce in a beaten-up trade, not a fresh leg of a rally.
| Series | Ret Pct |
|---|---|
| joint | 2.98 |
| tight50 | 4.31 |
| market | 0.65 |
| rest | -0.01 |
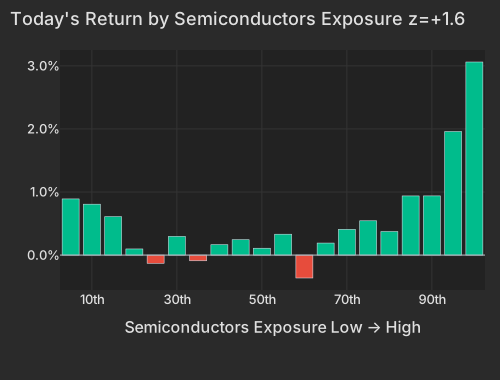
Semiconductors are the visible face of the move: the Semiconductors factor is up +0.93% (z=1.6), with SMH +3.52% and the memory names out front — Micron +6.00%, Western Digital +7.13%, Seagate +5.79%, Sandisk +7.35%, and the DRAM ETF +6.65%. The tailwind is real: Chinese semiconductor shares jumped 8.9%, lifting mainland indices and global chip sentiment. Economic Times But the decomposition says these are not company-specific stories: WDC, STX, SNDK and MaxLinear (+6.32%) all print as factor-driven, with their own idiosyncratic move near zero — this is beta and momentum doing the lifting, not a storage-demand catalyst. It coincides with an escalating US–China contest over AI models, where Beijing is weighing tighter export controls on chips and models even as Alibaba's new Qwen release lifted its shares. FT
| ETF | Theme | Today | 1d Ago | 5d Ago | 20d Ago | 63d Ago |
|---|---|---|---|---|---|---|
| DRAM | memory chips & storage | +6.65% | +0.64% | -7.40% | -30.83% | +49.09% |
| SMH | semiconductors | +3.52% | +0.41% | -4.57% | -15.31% | +20.40% |
| MTUM | momentum | +2.37% | +0.18% | -3.81% | -10.60% | +10.27% |
| QQQ | large-cap growth | +1.35% | +0.10% | -2.20% | -6.02% | +7.28% |
| SPY | large cap | +0.43% | -0.16% | -0.95% | -0.62% | +4.50% |
| IGV | software | -1.01% | +0.19% | +0.30% | +4.37% | +9.29% |
| XLV | healthcare | -0.80% | -1.14% | -1.34% | +6.59% | +7.02% |
| Bucket | Avg Ret Pct |
|---|---|
| 1 | 0.89 |
| 2 | 0.81 |
| 3 | 0.61 |
| 4 | 0.10 |
| 5 | -0.13 |
| 6 | 0.30 |
| 7 | -0.09 |
| 8 | 0.16 |
| 9 | 0.24 |
| 10 | 0.11 |
| 11 | 0.33 |
| 12 | -0.36 |
| 13 | 0.19 |
| 14 | 0.41 |
| 15 | 0.54 |
| 16 | 0.37 |
| 17 | 0.94 |
| 18 | 0.94 |
| 19 | 1.96 |
| 20 | 3.06 |
The split between SMH and software (IGV -1.01%) is telling: the high-beta chip complex is bid while software, which held a positive 20-day return, gives a little back. That is the low-correlation tape in miniature — adjacent tech exposures moving in opposite directions on the same morning.
The other half of the record-low correlation is the earnings wreckage, and it is almost entirely idiosyncratic. Danaher fell -14.27% — the largest stock-specific move in its trailing year — as soft Q3 bioprocessing guidance overshadowed a beat-and-raise quarter. Bloomberg MSCI dropped -12.02% on a rare EPS miss and higher expense guidance the SEC, and Equifax slid -10.46% after slashing its full-year revenue outlook well below consensus. Bloomberg On the other side, 3M rose +6.50% and O'Reilly jumped +6.95% on a reported $10 billion bid for Genuine Parts' NAPA division — each a stand-alone story, none of them the index. Zions, meanwhile, fell in the regional-bank complex after a margin miss and a JPMorgan downgrade. Morningstar
The honest tension: these are the two things that generate low correlation at once — a beta bounce concentrated in one profile, and a wall of one-off earnings blowups — and both are being read pre-open in thin liquidity, so the session-so-far variance mix overstates how idiosyncratic the day will finish. The regime signal to trust is the blended 20-day correlation, and that one is unambiguous regardless of the bell. Rates are not the driver here: the 10-year Treasury yield is essentially unchanged at 4.60%. CNBC The dividend-yield tilt (z=1.5) firming alongside the high-beta bid is the only faint defensive cross-current, and it is small.
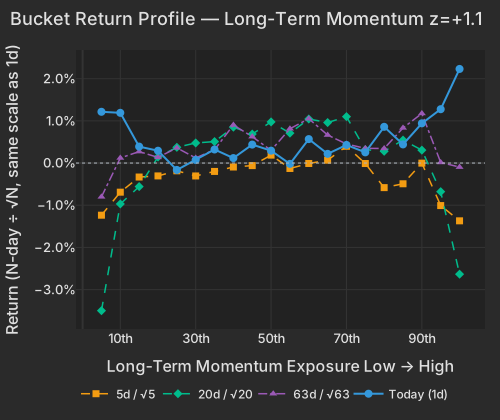
| Bucket | Ret 1D Pct | Ret 5D Norm Pct | Ret 20D Norm Pct | Ret 63D Norm Pct |
|---|---|---|---|---|
| 1 | 1.21 | -1.24 | -3.50 | -0.80 |
| 2 | 1.19 | -0.69 | -0.97 | 0.12 |
| 3 | 0.39 | -0.33 | -0.56 | 0.27 |
| 4 | 0.29 | -0.30 | 0.14 | 0.13 |
| 5 | -0.16 | -0.18 | 0.37 | 0.36 |
| 6 | 0.07 | -0.31 | 0.48 | 0.12 |
| 7 | 0.32 | -0.20 | 0.51 | 0.32 |
| 8 | 0.12 | -0.09 | 0.85 | 0.90 |
| 9 | 0.44 | -0.06 | 0.69 | 0.63 |
| 10 | 0.29 | 0.19 | 0.98 | 0.30 |
| 11 | -0.02 | -0.13 | 0.71 | 0.81 |
| 12 | 0.57 | -0.01 | 1.04 | 1.05 |
| 13 | 0.22 | 0.07 | 0.96 | 0.66 |
| 14 | 0.43 | 0.40 | 1.10 | 0.45 |
| 15 | 0.25 | -0.01 | 0.32 | 0.35 |
| 16 | 0.86 | -0.58 | 0.28 | 0.35 |
| 17 | 0.44 | -0.49 | 0.54 | 0.83 |
| 18 | 0.94 | -0.00 | 0.31 | 1.18 |
| 19 | 1.28 | -1.01 | -0.68 | 0.01 |
| 20 | 2.23 | -1.37 | -2.63 | -0.10 |
For a book, the places to look are the obvious high-beta momentum vehicles — SMH, DRAM, MTUM — where a bounce off a 20-day drawdown is doing the work, against the single-name gaps in DHR, MSCI and EFX that no factor exposure would have hedged. The residual volatility of the day lives in the names, not the index.
The Philadelphia Fed Non-Manufacturing Business Outlook Survey, released at 8:30 AM ET, signaled a sharp rebound in regional service-sector activity after a weak prior reading — a supportive but second-order print given how thoroughly today's tape is being set by cross-sectional factor churn rather than the macro calendar.
Variance decomposition: live intraday — 20260721 session, bracketed against its trailing-year range. Factor returns are trailing through last close. Total cross-sectional dispersion: 11%ile of the past year.
Variance mix — % of total, today vs 1d ago vs 1-yr avg
market 63%ile style 98.8%ile thematic 27%ile idiosyncratic 3.6%ile
Variance explained — today vs. factor's trailing-year range
Marker = the factor's share of today's total variance, placed in its own trailing-year range (box 25–75%ile, ticks 90%ile and max). Amber marker = unusually load-bearing today (≥90%ile of its own year). Factor name green = up today / red = down.
Correlation & dispersion — realized vs implied
Pairwise realized correlation (20d): 3.83% 0.1%ile
Top-500 pairwise: 5.56% 0.5%ile · implied (Cboe COR1M): 6.81 0.7%ile of its own history (gap -1.2pp)
Realized 20d vol (ann. pts): all stocks 46 vs VIXEQ 51 · index 8 vs VIX 18 · style factors 27 92.6%ile
20-day window (19 completed days + today); percentiles vs model history since 2020; definitions in Terms below. Implied prints (Cboe) are delayed ~15 min. as of 08:41 ET
Top 50 high-beta momentum names (eq-wt, since-2020 rank): +4.3% 94.1%ile · rest of market -0.0%
| Factor | Today | 1d | 5d | 20d | 60d |
|---|---|---|---|---|---|
| Style-Risk | |||||
| Beta | +1.32% z+1.4 | +0.12% | -2.41% | -11.30% | -1.82% |
| International | +0.18% z+0.6 | -0.04% | -0.04% | -0.06% | -1.74% |
| Residual Volatility | +0.16% z+0.3 | +0.46% | -0.82% | -0.76% | -1.77% |
| Style | |||||
| Dividend Yield | +0.28% z+1.5 | +0.01% | +0.27% | -0.84% | +0.79% |
| Profitability | +0.19% z+1.0 | +0.03% | -0.02% | -1.07% | -0.99% |
| Leverage | +0.12% z+0.7 | -0.17% | -0.27% | -1.54% | -0.61% |
| Liquidity | +0.14% z+0.5 | +0.77% | +0.03% | -1.88% | -1.46% |
| Growth | -0.10% z-0.4 | +0.13% | +0.19% | +1.65% | +2.08% |
| Value | +0.06% z+0.3 | +0.01% | -0.00% | -0.93% | -1.05% |
| Size | +0.05% z+0.1 | +0.18% | -0.34% | -0.85% | +1.19% |
| Style-Momentum | |||||
| Medium-Term Momentum | -0.48% z-1.6 | -0.13% | +0.31% | -0.19% | +3.47% |
| Long-Term Momentum | +0.71% z+1.1 | -0.07% | -1.00% | -3.16% | +2.66% |
| Short-Term Momentum | -0.25% z-0.8 | -0.14% | -0.23% | -0.65% | -1.99% |
| One-Day Momentum | +0.01% z+0.0 | -0.27% | -1.04% | -1.40% | +0.90% |
| Style-Positioning | |||||
| Hedge-Fund Ownership | -0.12% z-1.1 | -0.04% | +0.15% | +1.12% | -0.75% |
| Short Interest | -0.10% z-0.6 | -0.26% | -0.05% | +1.33% | +1.51% |
| Style-Flow | |||||
| Short-Sale Activity | -0.08% z-0.7 | -0.06% | +0.02% | -0.13% | -0.24% |
| Morning Activity | -0.05% z-0.3 | +0.00% | -0.17% | -0.10% | -1.76% |
| Thematic | |||||
| Semiconductors | +0.93% z+1.6 | +0.17% | -0.99% | -4.49% | +0.91% |
| Bitcoin / Crypto | +0.11% z+0.4 | +0.30% | -0.19% | -0.79% | -1.60% |
| Oil | +0.16% z+0.3 | +0.51% | -0.07% | +0.07% | -1.13% |
| Gold | -0.05% z-0.2 | +0.13% | +0.01% | -0.76% | -4.57% |
| China | -0.03% z-0.1 | +0.30% | +0.39% | +0.20% | -4.92% |
| Treasury (Duration) | +0.01% z+0.0 | -0.41% | +0.30% | +0.44% | -1.23% |
Pairwise realized correlation. Index variance net of the weighted idiosyncratic diagonal, over the cross terms — the estimator used for implied-correlation indices. 20-day window unless noted; history since 2020.
Factor z-score. Today's factor return divided by its daily-return standard deviation over ~1,600 trading days.
High-beta momentum cohort. US names above $2B market cap in the top quintile of both raw beta and 12-month momentum; membership frozen at each month's first business day. “Top 50” = the 50 strongest by combined rank.
Dispersion (realized). Total cross-sectional volatility net of the market component; high dispersion is the flip side of low correlation.
Stock-specific (idiosyncratic) return. The part of a stock's move not explained by market, style, or thematic factors in our decomposition.
VIXEQ / DSPX / COR1M. Cboe implied indices: single-stock volatility, dispersion, and 1-month implied correlation (top-50 S&P names). Quotes delayed ~15 minutes.
Data compiled by FactorPulse AI; edited and verified by Jeff Klein. For informational purposes only. Does not constitute financial advice, an investment recommendation, or an offer to buy or sell any securities. Always consult a qualified financial professional before making investment decisions.
For more on factor construction methodology, see www.factorpulse.com/glossary.