The index is standing nearly still while single stocks go their own way. Twenty-day realized pairwise correlation is 3.9%, the 0.1st percentile since 2020, and the market explains just 3.0% of cross-sectional variance — beneath it, Beta and Long-Term Momentum are both running 95th-percentile variance shares. Today that style churn took the form of a sharp bounce in the most beaten-down high-beta momentum names, up +3.81% against just +0.21% for everything else.
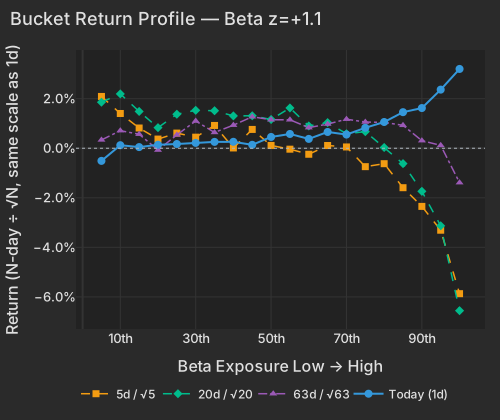
Beta led the style block, up +1.03% (z=+1.1) — but the number that matters is the 20-day z of −2.4: today is a rebound against a multi-week beta selloff, not a trend turning. Liquidity (z=+1.2) and Long-Term Momentum leaned the same way, the highest-turnover names and the strongest 1-year winners both outperforming. One-Day Momentum ran slightly negative (z=−0.4) — yesterday's losers edged yesterday's gainers, a mild reversal and nothing more.
| Factor | Return | Z-Score | 5d Z | 20d Z | 63d Z | Category | Direction |
|---|---|---|---|---|---|---|---|
| Beta | +1.03% | 1.1 | -0.7 | -2.4 | -0.1 | Risk | High-beta led |
| Liquidity | +0.34% | 1.2 | -0.6 | -1.8 | -0.5 | Style | High-turnover led |
| Long-Term Momentum | +0.30% | 0.5 | -0.4 | -1.0 | 0.8 | Momentum | 1-yr winners led |
| One-Day Momentum | -0.13% | -0.4 | -1.3 | -0.9 | 0.9 | Momentum | Yesterday's losers rebounded |
| Residual Volatility | +0.16% | 0.3 | -1.0 | -0.5 | -0.2 | Risk | Higher-vol led |
| Gold | -0.11% | -0.3 | -0.3 | -0.7 | -2.3 | Thematic | Gold names lagged |
| Bucket | Ret 1D Pct | Ret 5D Norm Pct | Ret 20D Norm Pct | Ret 63D Norm Pct |
|---|---|---|---|---|
| 1 | -0.51 | 2.09 | 1.86 | 0.33 |
| 2 | 0.12 | 1.40 | 2.19 | 0.71 |
| 3 | 0.05 | 0.82 | 1.49 | 0.57 |
| 4 | 0.14 | 0.37 | 0.83 | -0.07 |
| 5 | 0.17 | 0.61 | 1.37 | 0.54 |
| 6 | 0.22 | 0.45 | 1.53 | 1.10 |
| 7 | 0.26 | 0.92 | 1.51 | 0.64 |
| 8 | 0.26 | 0.01 | 1.31 | 0.93 |
| 9 | 0.14 | 0.76 | 1.31 | 1.27 |
| 10 | 0.46 | 0.11 | 1.16 | 1.15 |
| 11 | 0.58 | -0.04 | 1.63 | 1.15 |
| 12 | 0.38 | -0.24 | 0.90 | 0.83 |
| 13 | 0.66 | 0.11 | 1.04 | 0.98 |
| 14 | 0.55 | 0.05 | 0.58 | 1.17 |
| 15 | 0.83 | -0.74 | 0.67 | 1.06 |
| 16 | 1.06 | -0.62 | 0.03 | 1.04 |
| 17 | 1.46 | -1.59 | -0.62 | 0.93 |
| 18 | 1.62 | -2.35 | -1.74 | 0.31 |
| 19 | 2.37 | -3.31 | -3.13 | 0.12 |
| 20 | 3.20 | -5.87 | -6.56 | -1.39 |
The ETF tape says the same thing in cash terms: the complexes hit hardest over the past month bounced the most. Semiconductors, memory chips, Korea and crypto miners all snapped back off deep 20-day drawdowns, while oil and volatility went the other way.
| ETF | Theme | Today | 1d Ago | 5d Ago | 20d Ago | 63d Ago |
|---|---|---|---|---|---|---|
| WGMI | crypto miners | +6.33% | -1.10% | -14.29% | -30.80% | +2.13% |
| DRAM | memory chips | +3.58% | +0.73% | -16.37% | -24.63% | +50.46% |
| FXI | china | +2.80% | -1.16% | +1.94% | +1.43% | -8.33% |
| SMH | semiconductors | +2.55% | -2.18% | -8.92% | -10.81% | +22.37% |
| EWY | south korea | +2.14% | -0.50% | -11.43% | -20.74% | +10.22% |
| MTUM | momentum | +1.62% | -0.44% | -6.12% | -7.98% | +11.55% |
| QQQ | large-cap growth | +1.07% | -1.50% | -4.16% | -3.76% | +8.57% |
| USO | oil | -1.42% | +3.91% | +14.04% | +8.52% | -1.49% |
| VXX | volatility | -3.57% | +4.80% | +6.39% | -4.50% | -23.28% |
Strip out the bounce and the deeper structure is what a terminal can't show a PM. Over the trailing 20 days the market leg explains just 3.0% of the cross-section's variance, the 0.1st percentile since 2020; pairwise realized correlation is 3.9%, essentially its floor for the period. This is not calm everywhere: single-stock implied vol (Cboe VIXEQ) is at 50.5, the 98.5th percentile of its history, and implied dispersion (Cboe DSPX) is at the 99.8th percentile. Index vol is ordinary — implied index vol (Cboe VIX) at 18.2, around the 54th percentile — and the gap between a middling index and record-cheap correlation is the whole regime.
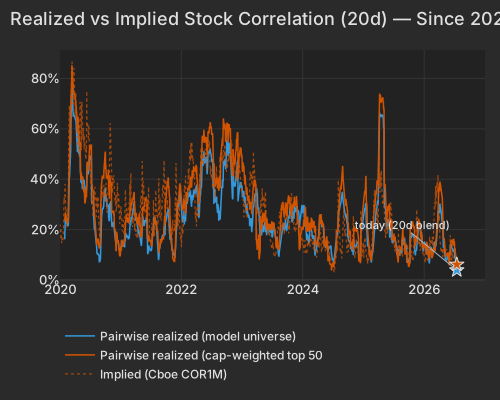
| Series | Today Pct | Prev Close Pct |
|---|---|---|
| pairwise_model | 3.92 | 3.53 |
| pairwise_top500 | 6.14 | 6.25 |
| implied_cor1m |
Implied correlation has come down to meet realized: Cboe COR1M is at 6.4, the lowest ~0.6% of its roughly 20-year history, and right on top of the like-for-like realized number (6.1% for the top-500 universe). Both realized and implied stock correlation are near record lows at once — there is essentially no correlation premium left to sell. Beneath the calm index, the style block is doing all the work: Beta carries 20.6% of 20-day variance (95th percentile) and Long-Term Momentum 6.3% (95th percentile), both extreme against their own year.
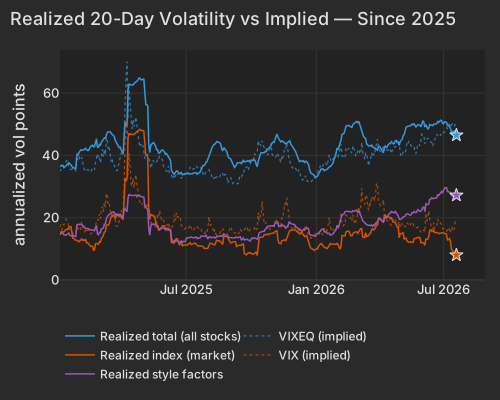
| Series | Today Vol Pts | Prev Close Vol Pts |
|---|---|---|
| total | 46.50 | 47.53 |
| market | 8.00 | 8.19 |
| style | 27.20 | 27.65 |
The caution rides in the same data. A good chunk of that record-cheap correlation is one complex moving alone: Semiconductor factor variance is at the 99th percentile of the trailing 20 days, SMH is off double digits on the month and memory names have corrected roughly a quarter (DRAM -24.63% over 20 days). Part of what reads as broad, healthy dispersion is really semis decoupling from an otherwise flat market — and today's high-beta rebound is a single session inside a deep hole. A PM's checklist here is short: MTUM and SMH for the beta and semiconductor snapback, DRAM for memory, and the dispersion complex (DSPX, COR1M) for where the correlation itself is priced.
The clearest expression of the churn is the crowded high-beta momentum cohort — the ~50 names screening top-quintile on both beta and 12-month momentum. It rose +3.81% today, a 92nd-percentile session since 2020, while everything outside it added only +0.21%; the wider 174-name version was up +2.25%. The move was rank-ordered in the characteristic itself — the tighter a name's high-beta-momentum fit, the bigger its gain, with the top-50 moving 1.7× the broad group against a 1.1× norm. These are the names that took the worst of it on July 13 and 16, extending the de-risking that ran from the July 1 momentum break; today is the first real relief.
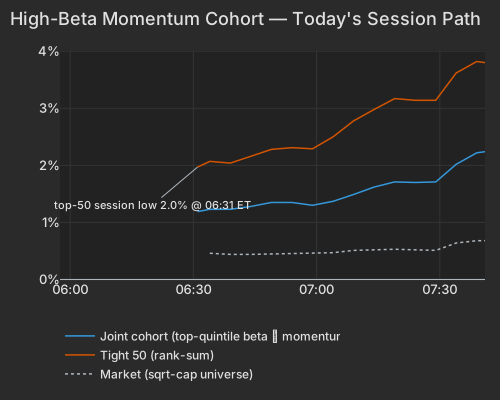
| Series | Ret Pct |
|---|---|
| joint | 2.25 |
| tight50 | 3.81 |
| market | 0.68 |
| rest | 0.21 |
Careful with the word re-risking: the flow signature from the prior session was liquid-first selling with cohort volume below the tape's pace and no basket-shaped co-movement — the group was being pared, not panic-dumped — and the broad version is still 19.8% below its high. One green session does not reverse that. It also matters that the biggest single-name movers are beta-carried, not stories: MU +5.06% and SNDK +4.81% are almost entirely style, their stock-specific components near zero — the memory rally is the beta bid, not a fresh demand signal.
Where the low-correlation market actually paid was in the names moving on their own news, and there were plenty. Domino's leapt +7.72% — its largest stock-specific move in a year — after Q2 revenue of $1.19B beat and management flagged "meaningful" order-count growth, a relief rally following a roughly 23% year-to-date slide.Bloomberg Hut 8 ran +15.27% on a $9.8B lease expansion that doubles its Texas AI-campus capacity.Bloomberg On the other side, HDFC Bank fell -4.04% — again its own move — after Q1 net interest margin compressed to a post-merger low of 3.26%.Bloomberg Idiosyncratic variance is 60% of the 20-day total; this is what that looks like name by name.
Two macro notes frame the edges. Oil went against the grain — USO fell -1.42% as the US–Iran risk premium kept draining after last month's agreement to reopen the Strait of Hormuz, leaving energy the rare group in the red.EIA And the leveraged AI selloff that has made Korea's KOSPI the world's most volatile major benchmark is the same pressure these high-beta names had been under — EWY +2.14% today is a small down payment on a 20-day drawdown north of 20%.Bloomberg
Variance decomposition: live intraday — 20260720 session, bracketed against its trailing-year range. Factor returns are trailing through last close. Total cross-sectional dispersion: 2.8%ile of the past year.
Variance mix — % of total, today vs 1d ago vs 1-yr avg
market 84%ile style 98.4%ile thematic 29%ile idiosyncratic 1.6%ile
Variance explained — today vs. factor's trailing-year range
Marker = the factor's share of today's total variance, placed in its own trailing-year range (box 25–75%ile, ticks 90%ile and max). Amber marker = unusually load-bearing today (≥90%ile of its own year). Factor name green = up today / red = down.
Correlation & dispersion — realized vs implied
Pairwise realized correlation (20d): 3.92% 0.1%ile
Top-500 pairwise: 6.14% 0.9%ile · implied (Cboe COR1M): 6.38 0.6%ile of its own history (gap -0.2pp)
Realized 20d vol (ann. pts): all stocks 46 vs VIXEQ 50 · index 8 vs VIX 18 · style factors 27 92.7%ile
20-day window (19 completed days + today); percentiles vs model history since 2020; definitions in Terms below. Implied prints (Cboe) are delayed ~15 min. as of 07:41 ET
Top 50 high-beta momentum names (eq-wt, since-2020 rank): +3.8% 92.5%ile · rest of market +0.2%
| Factor | Today | 1d | 5d | 20d | 60d |
|---|---|---|---|---|---|
| Style-Risk | |||||
| Beta | +1.04% z+1.1 | -0.46% | -5.08% | -9.42% | -1.05% |
| Residual Volatility | +0.16% z+0.3 | +0.19% | -1.25% | -1.31% | -1.62% |
| International | +0.01% z+0.0 | +0.01% | +0.08% | -0.42% | -1.82% |
| Style | |||||
| Liquidity | +0.33% z+1.1 | +0.26% | -0.73% | -2.57% | -1.39% |
| Leverage | +0.11% z+0.6 | -0.12% | -0.27% | -1.22% | -0.66% |
| Profitability | +0.07% z+0.4 | -0.23% | -0.16% | -0.89% | -1.19% |
| Value | +0.07% z+0.3 | -0.22% | +0.12% | -0.92% | -1.28% |
| Dividend Yield | +0.05% z+0.3 | +0.19% | +0.16% | -0.91% | +0.92% |
| Size | +0.06% z+0.1 | -0.26% | -0.58% | -0.98% | +1.48% |
| Growth | +0.01% z+0.0 | -0.06% | -0.02% | +1.66% | +2.18% |
| Style-Momentum | |||||
| Medium-Term Momentum | -0.19% z-0.6 | +0.01% | +0.27% | +0.47% | +3.54% |
| Long-Term Momentum | +0.30% z+0.5 | +0.87% | -1.24% | -2.76% | +3.10% |
| One-Day Momentum | -0.14% z-0.5 | -0.42% | -0.76% | -0.91% | +1.43% |
| Short-Term Momentum | -0.14% z-0.4 | -0.09% | +0.06% | -0.44% | -1.96% |
| Style-Positioning | |||||
| Short Interest | -0.02% z-0.1 | +0.00% | +0.15% | +1.69% | +1.66% |
| Hedge-Fund Ownership | -0.01% z-0.1 | -0.11% | +0.18% | +1.23% | -0.53% |
| Style-Flow | |||||
| Short-Sale Activity | +0.03% z+0.3 | -0.04% | +0.15% | +0.18% | -0.38% |
| Morning Activity | -0.01% z-0.1 | -0.17% | -0.06% | -0.24% | -1.75% |
| Thematic | |||||
| Semiconductors | +0.44% z+0.7 | +0.43% | -1.51% | -3.87% | +1.15% |
| Treasury (Duration) | -0.19% z-0.5 | +0.19% | +0.94% | +0.71% | -1.00% |
| Gold | -0.11% z-0.3 | +0.14% | +0.26% | -1.77% | -4.47% |
| China | +0.09% z+0.2 | -0.02% | +0.28% | -0.67% | -5.21% |
| Bitcoin / Crypto | +0.05% z+0.2 | +0.19% | -0.59% | -0.91% | -1.48% |
| Oil | -0.06% z-0.1 | +0.66% | +0.01% | -0.84% | -0.94% |
Pairwise realized correlation. Index variance net of the weighted idiosyncratic diagonal, over the cross terms — the estimator used for implied-correlation indices. 20-day window unless noted; history since 2020.
Market variance share. The fraction of cross-sectional variance explained by the market factor — the attribution companion to pairwise correlation, not a substitute for it.
Factor z-score. Today's factor return divided by its daily-return standard deviation over ~1,600 trading days.
High-beta momentum cohort. US names above $2B market cap in the top quintile of both raw beta and 12-month momentum; membership frozen at each month's first business day. “Top 50” = the 50 strongest by combined rank.
Dispersion (realized). Total cross-sectional volatility net of the market component; high dispersion is the flip side of low correlation.
Stock-specific (idiosyncratic) return. The part of a stock's move not explained by market, style, or thematic factors in our decomposition.
VIXEQ / DSPX / COR1M. Cboe implied indices: single-stock volatility, dispersion, and 1-month implied correlation (top-50 S&P names). Quotes delayed ~15 minutes.
Data compiled by FactorPulse AI; edited and verified by Jeff Klein. For informational purposes only. Does not constitute financial advice, an investment recommendation, or an offer to buy or sell any securities. Always consult a qualified financial professional before making investment decisions.
For more on factor construction methodology, see www.factorpulse.com/glossary.