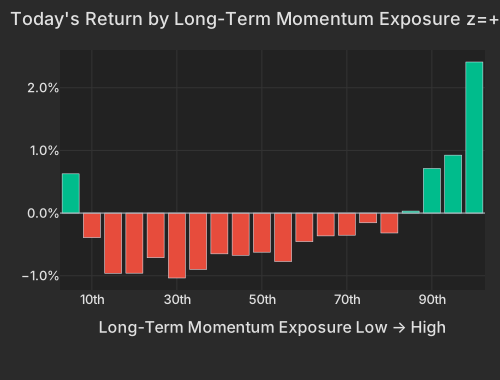
The factor tape reads as a set of independent signals, not one macro push. Long-Term Momentum — 1-year winners over 1-year laggards — firmed +0.95% (z=+1.5), Liquidity +0.48% (z=+1.7), while yesterday's losers snapped back to drive One-Day Momentum to -0.47% (z=-1.5), and Oil pushed +0.67% (z=+1.3). None is large in basis points; each is a clean, independent tilt, and that independence is exactly what a record-low correlation looks like from the factor side.
| Factor | Return | Z-Score | 5d Z | 20d Z | 63d Z | Category | Direction |
|---|---|---|---|---|---|---|---|
| Long-Term Momentum | +0.95% | +1.5 | -0.8 | -0.9 | +0.6 | Style-Momentum | Winners over laggards |
| Liquidity | +0.48% | +1.7 | -0.8 | -1.8 | -0.7 | Style | High-turnover bid |
| One-Day Momentum | -0.47% | -1.5 | -1.2 | -0.7 | +0.7 | Style-Momentum | Yesterday's losers rebound |
| Oil | +0.67% | +1.3 | 0.0 | -0.4 | -0.4 | Thematic | Oil-levered bid |
| Profitability | -0.24% | -1.3 | -0.4 | -1.0 | -0.7 | Style | Profitable names lagged |
| Semiconductors | +0.61% | +1.0 | -1.0 | -1.4 | +0.2 | Thematic | Chip names bid |
| Bucket | Avg Ret Pct |
|---|---|
| 1 | 0.63 |
| 2 | -0.39 |
| 3 | -0.96 |
| 4 | -0.96 |
| 5 | -0.71 |
| 6 | -1.04 |
| 7 | -0.90 |
| 8 | -0.65 |
| 9 | -0.67 |
| 10 | -0.62 |
| 11 | -0.77 |
| 12 | -0.46 |
| 13 | -0.36 |
| 14 | -0.35 |
| 15 | -0.15 |
| 16 | -0.32 |
| 17 | 0.03 |
| 18 | 0.71 |
| 19 | 0.92 |
| 20 | 2.41 |
Split the tape into its parts and the index leg is nearly dead: over the trailing 20 days the market factor carried 8.0 vol points of the cross-section (0.5th percentile since 2020) against 27.7 points in the style block (94th) and 36.7 in stock-specific moves. Today's session runs 70% idiosyncratic. The names doing the work are marked on their own stories: Intuitive Surgical fell -13.2%, its largest stock-specific move in a year, after U.S. da Vinci procedure growth cooled to 12% despite a Q2 beatNYT; Travelers jumped +8.3% on core EPS of $10.04 against a $5.21 consensusBarron's; and Coca-Cola dropped -4.36% on a stock-specific disruption at its fairlife unit.
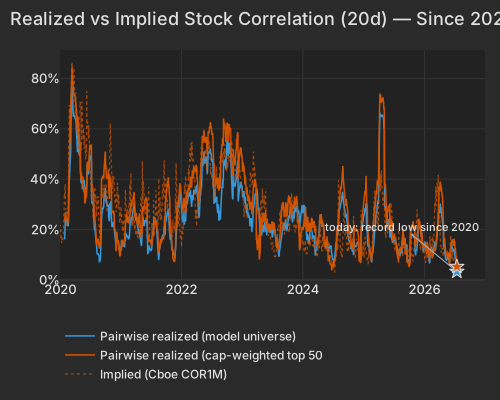
| Series | Today Pct | Prev Close Pct |
|---|---|---|
| pairwise_model | 3.36 | 4.21 |
| pairwise_top500 | 5.29 | 7.02 |
| implied_cor1m |
The sharpest single-name driver is Moonshot AI's Kimi K3, a 2.8-trillion-parameter open-weight model priced to undercut Western APIsBloomberg. Cadence and Synopsys — the electronic-design-automation pair — fell -10.1% and -9.5%, and the return split says almost all of it was stock-specific rather than a sector beta moveBloomberg. Netflix slid -7.8% after guiding Q3 revenue below the Street and promising fewer engagement disclosuresNYT. Yet the Semiconductors factor actually rose +0.61% (z=+1.0) and SMH fell only -1.36% — the AI worry is concentrated in a handful of names, not a broad chip selloff, even with the group in a bear market after its runBloomberg. The reaction isn't uniform: Seagate rose +6.78% and the memory-chip complex (DRAM ETF +3.65%) firmed on the DRAM-shortage story even as the margin fear marked down software.
Sector medians show the same fracture — Energy the only gainer at +0.98% as WTI jumped on renewed U.S.–Iran escalation and eroding Strait of Hormuz tanker trafficBloomberg, against Consumer Discretionary -1.15%, Consumer Staples -1.05% and Communication Services -0.91%.
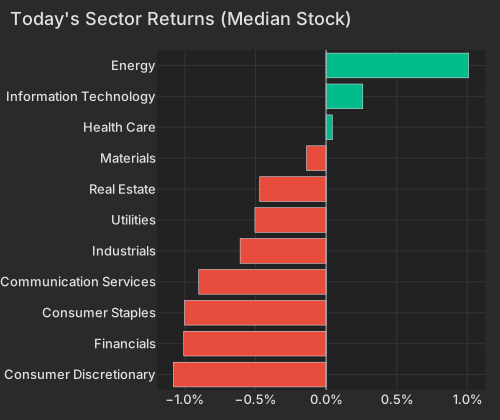
| Sector | Median Ret Pct |
|---|---|
| Consumer Discretionary | -1.08 |
| Financials | -1.01 |
| Consumer Staples | -1.00 |
| Communication Services | -0.90 |
| Industrials | -0.61 |
| Utilities | -0.50 |
| Real Estate | -0.47 |
| Materials | -0.14 |
| Health Care | 0.04 |
| Information Technology | 0.26 |
| Energy | 1.01 |
| ETF | Theme | Today | 1d Ago | 5d Ago | 20d Ago | 63d Ago |
|---|---|---|---|---|---|---|
| USO | oil | +4.20% | -1.71% | +9.44% | +3.32% | -2.68% |
| VXX | volatility | +3.90% | +2.88% | -0.60% | -4.96% | -26.87% |
| XOP | oil E&P | +1.77% | +0.96% | +4.38% | +5.90% | +1.33% |
| XLE | energy | +0.82% | +0.92% | +4.01% | +3.00% | +2.26% |
| SMH | semiconductors | -1.36% | -3.70% | -6.39% | -7.64% | +25.59% |
| XLP | consumer staples | -1.15% | +2.80% | +3.14% | +0.26% | +5.86% |
| QQQ | large-cap growth | -0.96% | -1.64% | -2.40% | -3.28% | +10.75% |
| IGV | software | -0.32% | -0.26% | -0.19% | +2.55% | +12.92% |
What churns under the index is the style block, and its spine is the beta–momentum axis: beta alone carried 20.6% of the trailing 20-day variance (96th percentile) and Long-Term Momentum 6.0% (95th). That is where the crowded trade lives. The high-beta momentum cohort — names in the top quintile on both beta and 12-month momentum, membership frozen at the month's start — has been the market's stress point, with extreme down days on July 16 and 13Bloomberg. Today the top 50 such names bounced +1.92% off a -6.68% intraday low while the rest of the market fell -0.62%; the tightest 50 moving 1.56× the broader ~190-name group — well above the usual 1.14× — is the signature of a basket being traded as one, in both directions.
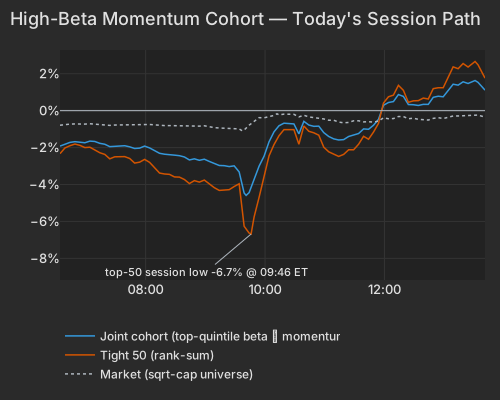
| Series | Ret Pct |
|---|---|
| joint | 1.23 |
| tight50 | 1.92 |
| market | -0.32 |
| rest | -0.62 |
This is why the record-low correlation is not complacency. Implied single-stock volatility (Cboe VIXEQ) sits at 49.99, its 98th percentile, and expected dispersion (Cboe DSPX) at 46.72 is near a six-year highFT — the options market is paid to expect exactly this single-stock churn. The catch is the index leg: VIX ticked up a full point to 17.73 and VXX rallied +3.90%, while the long end caught a mild safe-haven bid, the 10-year Treasury yield easing to 4.55%, down about 2 basis points CNBC. If a macro shock pulls names back together, a record set on a trailing 20-day window can mean-revert quickly. For a book, the exposure map is clear: the earnings singles (TRV, ISRG, NFLX), the Kimi-hit EDA pair (CDNS, SNPS, and IGV), energy (USO, XLE, XOP) against the beta–momentum names in SMH and MTUM, and dispersion vehicles priced for the split to hold.
The University of Michigan data.sca.isr.umich.edu preliminary sentiment index, released at 10:00 AM ET, jumped to 54.4 in July from 49.5, well above the 51.0 consensus, with one-year inflation expectations cooling to 4.2% from 4.6%Bloomberg; the survey director cautioned most responses predated the recent gasoline re-acceleration. The New York Fed Staff Nowcast, released at 12:45 PM ET, held Q2 2026 GDP bea.gov growth at 2.7% and Q3 at 2.4%, though the Atlanta Fed's GDPNow tracks materially lower at 1.7%.
Variance decomposition: live intraday — 20260717 session, bracketed against its trailing-year range. Factor returns are trailing through last close. Total cross-sectional dispersion: 10%ile of the past year.
Variance mix — % of total, today vs 1d ago vs 1-yr avg
market 49%ile style 76%ile thematic 54%ile idiosyncratic 38%ile
Variance explained — today vs. factor's trailing-year range
Marker = the factor's share of today's total variance, placed in its own trailing-year range (box 25–75%ile, ticks 90%ile and max). Amber marker = unusually load-bearing today (≥90%ile of its own year). Factor name green = up today / red = down.
Correlation & dispersion — realized vs implied
Pairwise realized correlation (20d): 3.36% 0.0%ile record low since 2020
Top-500 pairwise: 5.29% 0.4%ile · implied (Cboe COR1M): 5.35 0.4%ile of its own history (gap -0.1pp)
Realized 20d vol (ann. pts): all stocks 47 vs VIXEQ 50 · index 8 vs VIX 18 · style factors 28 94.0%ile
20-day window (19 completed days + today); percentiles vs model history since 2020; definitions in Terms below. Implied prints (Cboe) are delayed ~15 min. as of 13:41 ET
Top 50 high-beta momentum names (eq-wt, since-2020 rank): +1.9% 75%ile · rest of market -0.6%
| Factor | Today | 1d | 5d | 20d | 60d |
|---|---|---|---|---|---|
| Style-Risk | |||||
| Residual Volatility | +0.45% z+0.9 | -0.78% | -1.92% | -1.48% | -1.37% |
| Beta | +0.22% z+0.2 | -3.02% | -5.01% | -8.16% | -1.19% |
| International | -0.06% z-0.2 | -0.28% | +0.24% | -0.28% | -2.20% |
| Style | |||||
| Liquidity | +0.48% z+1.6 | -0.71% | -1.04% | -3.26% | -1.92% |
| Profitability | -0.24% z-1.2 | +0.51% | +0.60% | -0.92% | -0.94% |
| Dividend Yield | +0.16% z+0.8 | +0.05% | +0.15% | -1.02% | +0.90% |
| Size | -0.28% z-0.7 | -0.32% | -0.08% | -0.60% | +1.88% |
| Value | -0.14% z-0.6 | +0.37% | +0.68% | -1.22% | -0.84% |
| Leverage | -0.10% z-0.6 | +0.03% | -0.11% | -1.20% | -0.82% |
| Growth | +0.07% z+0.3 | -0.05% | -0.08% | +1.66% | +2.17% |
| Style-Momentum | |||||
| One-Day Momentum | -0.47% z-1.5 | +0.10% | -0.48% | -0.50% | +2.50% |
| Long-Term Momentum | +0.95% z+1.4 | -1.23% | -2.63% | -2.72% | +2.85% |
| Short-Term Momentum | -0.15% z-0.5 | +0.08% | +0.03% | +0.04% | -1.89% |
| Medium-Term Momentum | -0.00% z-0.0 | +0.38% | +0.07% | +0.65% | +3.55% |
| Style-Positioning | |||||
| Hedge-Fund Ownership | -0.14% z-1.2 | +0.00% | +0.28% | +1.31% | -0.64% |
| Short Interest | -0.06% z-0.3 | +0.32% | +0.05% | +1.80% | +1.88% |
| Style-Flow | |||||
| Morning Activity | -0.15% z-1.1 | -0.17% | +0.02% | -0.23% | -1.58% |
| Short-Sale Activity | -0.04% z-0.3 | +0.22% | +0.20% | +0.19% | -0.42% |
| Thematic | |||||
| Oil | +0.67% z+1.3 | -0.82% | -0.86% | -1.35% | -0.77% |
| Bitcoin / Crypto | +0.34% z+1.1 | -0.66% | -1.10% | -0.92% | -2.08% |
| Semiconductors | +0.61% z+1.0 | -0.74% | -1.82% | -3.65% | +0.59% |
| China | -0.25% z-0.6 | -0.23% | +0.51% | -0.76% | -5.64% |
| Gold | +0.18% z+0.5 | -0.35% | -0.02% | -1.95% | -5.68% |
| Treasury (Duration) | +0.14% z+0.4 | +0.28% | +0.95% | +0.58% | -1.68% |
Pairwise realized correlation. Index variance net of the weighted idiosyncratic diagonal, over the cross terms — the estimator used for implied-correlation indices. 20-day window unless noted; history since 2020.
Market variance share. The fraction of cross-sectional variance explained by the market factor — the attribution companion to pairwise correlation, not a substitute for it.
Factor z-score. Today's factor return divided by its daily-return standard deviation over ~1,600 trading days.
High-beta momentum cohort. US names above $2B market cap in the top quintile of both raw beta and 12-month momentum; membership frozen at each month's first business day. “Top 50” = the 50 strongest by combined rank.
Dispersion (realized). Total cross-sectional volatility net of the market component; high dispersion is the flip side of low correlation.
Stock-specific (idiosyncratic) return. The part of a stock's move not explained by market, style, or thematic factors in our decomposition.
VIXEQ / DSPX / COR1M. Cboe implied indices: single-stock volatility, dispersion, and 1-month implied correlation (top-50 S&P names). Quotes delayed ~15 minutes.
Data compiled by FactorPulse AI; edited and verified by Jeff Klein. For informational purposes only. Does not constitute financial advice, an investment recommendation, or an offer to buy or sell any securities. Always consult a qualified financial professional before making investment decisions.
For more on factor construction methodology, see www.factorpulse.com/glossary.