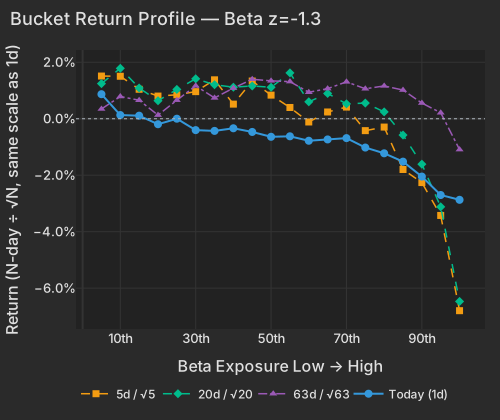
Moonshot's open-weight Kimi K3, launched this morning, has cracked the most-owned corner of the AI trade: the top-50 high-beta momentum names are down -3.46% against -0.28% for the rest of the market, even as the S&P 500 gives up only -0.85%. Beta is doing the damage — z=-1.32 today, a 5-day z=-2.69 — and beneath it realized 20-day stock correlation sits at 3.1%, a record low since 2020. This is concentrated selling, not a broad retreat.
The catalyst is specific and fresh. Beijing-based Moonshot AI released Kimi K3, a 2.8-trillion-parameter open-weight model whose early benchmarks trail only the top US frontier systems, and said it would fully open-source the model by late July.Bloomberg A frontier-tier model that enterprises can self-host commoditizes the intelligence US hyperscalers sell by the API call — and the market read it straight through to peak-margin fears in AI hardware and memory. The Philadelphia Semiconductor Index dropped more than 4% and Asian chip names sold off despite record TSMC earnings, with Japan's Kioxia shedding 16% of its market value.Economic Times
The Semiconductors factor itself is quiet on a clean basis — -0.24% (z=-0.41) today — but its 5-day z=-1.64 and 20-day z=-1.70 say the chip complex has been leaking for weeks, and today extends that rather than breaking it. The load-bearing move is Beta: high-beta names underperformed low-beta by -1.30% (z=-1.32), and the 5-day z=-2.69 marks this as the continuation of a multi-week bleed in market-sensitive names.
| Factor | Return | Z-Score | 5d Z | 20d Z | 63d Z | Category | Direction |
|---|---|---|---|---|---|---|---|
| Beta | -1.30% | -1.32 | -2.69 | -2.33 | -0.10 | Style-Risk | High-beta lagged |
| Residual Volatility | -0.43% | -0.86 | -1.65 | -0.85 | -0.56 | Style-Risk | Volatile names lagged |
| Size | -0.25% | -0.65 | -0.66 | -0.57 | +0.30 | Style | Large-caps lagged |
| Semiconductors | -0.24% | -0.41 | -1.64 | -1.70 | -0.01 | Thematic | Chip-heavy lagged |
| Treasury (Duration) | +0.43% | +1.26 | +1.52 | +0.62 | -0.50 | Thematic | Long-duration led |
| Bucket | Ret 1D Pct | Ret 5D Norm Pct | Ret 20D Norm Pct | Ret 63D Norm Pct |
|---|---|---|---|---|
| 1 | 0.87 | 1.51 | 1.24 | 0.35 |
| 2 | 0.13 | 1.50 | 1.79 | 0.79 |
| 3 | 0.11 | 1.04 | 1.09 | 0.66 |
| 4 | -0.19 | 0.80 | 0.64 | 0.13 |
| 5 | 0.00 | 0.85 | 1.04 | 0.66 |
| 6 | -0.40 | 0.96 | 1.42 | 1.17 |
| 7 | -0.43 | 1.38 | 1.21 | 0.74 |
| 8 | -0.34 | 0.52 | 1.12 | 1.09 |
| 9 | -0.47 | 1.34 | 1.16 | 1.40 |
| 10 | -0.64 | 0.84 | 1.12 | 1.34 |
| 11 | -0.62 | 0.40 | 1.62 | 1.32 |
| 12 | -0.78 | -0.11 | 0.60 | 0.94 |
| 13 | -0.73 | 0.24 | 0.90 | 1.07 |
| 14 | -0.69 | 0.41 | 0.53 | 1.31 |
| 15 | -1.02 | -0.42 | 0.56 | 1.06 |
| 16 | -1.22 | -0.29 | 0.24 | 1.16 |
| 17 | -1.52 | -1.80 | -0.58 | 1.02 |
| 18 | -2.05 | -2.26 | -1.61 | 0.56 |
| 19 | -2.70 | -3.43 | -3.12 | 0.21 |
| 20 | -2.87 | -6.80 | -6.47 | -1.09 |
The names that fell hardest on beta carry no company story of their own: Vicor -4.63%, Astera Labs -4.92%, Applied Optoelectronics -5.08% and Ouster -3.95% all moved on the day's beta complex with almost no stock-specific component. Even TSM's -3.60% was style-carried rather than a reaction to its results. The instruments a PM should check against this are the ones that ran furthest and are now giving it back.
| ETF | Theme | Today | 1d Ago | 5d Ago | 20d Ago | 63d Ago |
|---|---|---|---|---|---|---|
| DRAM | memory chips | -4.12% | -8.82% | -18.68% | -23.16% | +51.84% |
| SMH | semiconductors | -3.49% | -3.70% | -6.39% | -7.64% | +25.59% |
| EWY | south korea | -3.16% | -4.82% | -11.58% | -20.66% | +12.72% |
| XLK | technology | -2.24% | -2.24% | -4.22% | -4.78% | +18.11% |
| MTUM | momentum | -1.89% | -2.96% | -5.54% | -6.94% | +12.38% |
| QQQ | large-cap growth | -1.78% | -1.64% | -2.40% | -3.28% | +10.75% |
| USO | oil | +2.46% | -1.71% | +9.44% | +3.32% | -2.68% |
| XLE | energy | +1.45% | +0.92% | +4.01% | +3.00% | +2.26% |
| TLT | long-term bonds | +0.45% | -0.04% | -0.33% | -2.30% | -3.02% |
Korea sits at the center of the damage — EWY -3.16% today and -20.66% over 20 days as the region's speculative AI-chip frenzy keeps unwinding.MarketWatch DRAM's -4.12% comes after a +51.84% quarter, the sharpest example of a name that had the most to give back.
Here is what the index print hides. Sort the market by fit to the high-beta momentum profile — names in the top quintile on both beta and 12-month momentum, membership frozen at the month's start — and the loss scales cleanly with how well a name fits it: the broad 176-name group fell -2.37%, the top-50 sub-group -3.46%, and the rest of the market only -0.28%. The tightest version of the trade fell fastest, and today's amplification ratio of 1.46 against a normal 1.14 is the signature of a systematic unwind of the beta-momentum trade rather than a verdict on any single name.
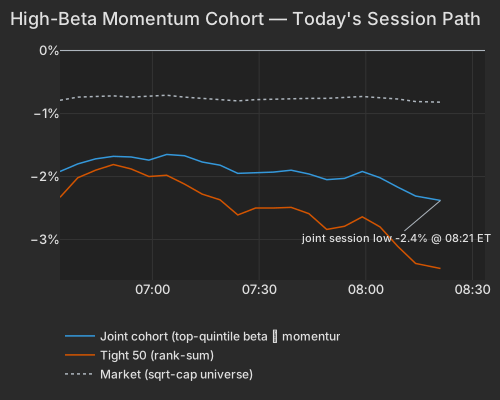
| Series | Ret Pct |
|---|---|
| joint | -2.37 |
| tight50 | -3.46 |
| market | -0.81 |
| rest | -0.28 |
Underneath, the index leg has gone quiet. Realized 20-day stock correlation is 3.1%, a record low since 2020, because the market explains barely 3% of cross-sectional variance while the style block churns in its 94th percentile — led by beta and long-term momentum. The options market agrees the index is calm relative to the churn beneath it: implied one-month single-stock correlation (Cboe COR1M) at 4.66 is in the lowest quarter-percent of its 20-year history. A violent factor move can hide under a flat tape, and today it is.
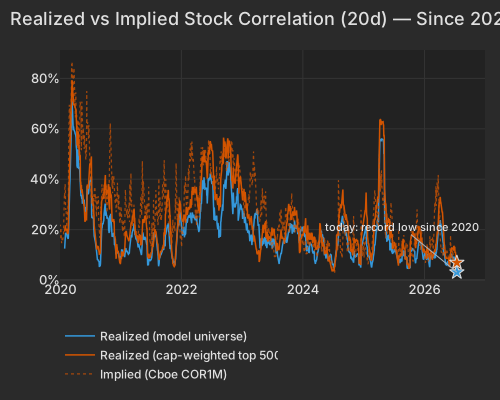
| Series | Today Pct | Prev Close Pct |
|---|---|---|
| realized_model | 3.10 | 3.42 |
| realized_top500 | 6.89 | 7.19 |
| implied_cor1m |
The clearest evidence the selling is targeted rather than broad: the day's two biggest single-stock moves have nothing to do with Kimi K3. Netflix fell -11.01% — a stock-specific move at the 100th percentile of its own year (idio z=-4.82) — after Q3 revenue guidance landed short of Street targets, and Intuitive Surgical dropped -10.32% (idio z=-6.13) on slowing US procedure growth despite an earnings beat. Both are earnings reactions, both idiosyncratic, and neither is the AI trade. With the S&P 500 off only -0.85%, the honest counter to a "broad AI collapse" read is that the pain is confined to one heavily-owned group while the rest of the market barely moves.
Money left high-beta tech and found two homes. Oil was the standout — USO +2.46%, XLE +1.45%, XOP +1.32% — with Strait of Hormuz shipping risk keeping a bid under crude.Bloomberg The other was duration: the Treasury factor gained +0.43% (z=+1.26) as yields slipped across the curve, the 10-year easing about 5 bps to 4.52% and the 2-year to 4.13%.CNBC TLT +0.45% and a flat dollar (DXY 100.80) round out a classic step back into safety while equities re-price the AI trade.
The Michigan Consumer data.sca.isr.umich.edu Survey (Preliminary) is due at 10:00 AM ET, with consensus looking for the sentiment index to tick up to 68.5 from 68.2; the 1-year and 5-year inflation expectations, both anchored at 3.0%, are the numbers to watch after a cooler June CPI bls.gov print that markets are still weighing against the risk of further Fed tightening.NYT The New York Fed Staff Nowcast update lands at 12:45 PM ET, expected to hold near 2.7% for Q2 and keep its wide gap over the Atlanta Fed's 1.7% GDPNow reading — the last such update before the July 28-29 FOMC federalreserve.gov meeting, where markets price an 80% probability of a hold.
Variance decomposition: live intraday — 20260717 session, bracketed against its trailing-year range. Factor returns are trailing through last close. Total cross-sectional dispersion: 7%ile of the past year.
Variance mix — % of total, today vs 1d ago vs 1-yr avg
market 84%ile style 96%ile thematic 60%ile idiosyncratic 2%ile
Variance explained — today vs. factor's trailing-year range
Marker = the factor's share of today's total variance, placed in its own trailing-year range (box 25–75%ile, ticks 90%ile and max). Amber marker = unusually load-bearing today (≥90%ile of its own year). Factor name green = up today / red = down.
Correlation & dispersion — realized vs implied
Realized correlation (20d): 3.10% 0%ile record low since 2020
Top-500 realized: 6.89% 4%ile · implied (Cboe COR1M): 4.66 0%ile of its own history
Realized 20d vol (ann. pts): all stocks 47 vs VIXEQ 49 · index 8 vs VIX 18 · style factors 28 94%ile
Realized correlation = the market's share of cross-sectional variance (20-day, 19 completed days + today); percentiles vs model history since 2020. Implied prints (Cboe) are delayed ~15 min. as of 08:21 ET
High-beta momentum cohort (eq-wt, since-2020 ranks): joint -2.4% 13%ile worst since 2026-07-16 · tight50 -3.5% 10%ile · rest of market -0.3%
| Factor | Today | 1d | 5d | 20d | 60d |
|---|---|---|---|---|---|
| Style-Risk | |||||
| Beta | -1.30% z-1.3 | -3.02% | -5.01% | -8.16% | -1.19% |
| Residual Volatility | -0.43% z-0.9 | -0.78% | -1.92% | -1.48% | -1.37% |
| International | -0.13% z-0.4 | -0.28% | +0.24% | -0.28% | -2.20% |
| Style | |||||
| Growth | -0.16% z-0.7 | -0.05% | -0.08% | +1.66% | +2.17% |
| Size | -0.25% z-0.7 | -0.32% | -0.08% | -0.60% | +1.88% |
| Leverage | +0.08% z+0.4 | +0.03% | -0.11% | -1.20% | -0.82% |
| Dividend Yield | +0.06% z+0.3 | +0.05% | +0.15% | -1.02% | +0.90% |
| Liquidity | +0.08% z+0.3 | -0.71% | -1.04% | -3.26% | -1.92% |
| Profitability | -0.04% z-0.2 | +0.51% | +0.60% | -0.92% | -0.94% |
| Value | +0.04% z+0.2 | +0.37% | +0.68% | -1.22% | -0.84% |
| Style-Momentum | |||||
| Medium-Term Momentum | -0.03% z-0.1 | +0.38% | +0.07% | +0.65% | +3.55% |
| One-Day Momentum | +0.03% z+0.1 | +0.10% | -0.48% | -0.50% | +2.50% |
| Long-Term Momentum | -0.06% z-0.1 | -1.23% | -2.63% | -2.72% | +2.85% |
| Short-Term Momentum | +0.02% z+0.1 | +0.08% | +0.03% | +0.04% | -1.89% |
| Style-Positioning | |||||
| Short Interest | -0.11% z-0.6 | +0.32% | +0.05% | +1.80% | +1.88% |
| Hedge-Fund Ownership | -0.04% z-0.3 | +-0.00% | +0.28% | +1.31% | -0.64% |
| Style-Flow | |||||
| Short-Sale Activity | +0.01% z+0.1 | +0.22% | +0.20% | +0.19% | -0.42% |
| Morning Activity | -0.01% z-0.1 | -0.17% | +0.02% | -0.23% | -1.58% |
| Thematic | |||||
| Treasury (Duration) | +0.43% z+1.3 | +0.28% | +0.95% | +0.58% | -1.68% |
| Gold | +0.16% z+0.5 | -0.35% | -0.02% | -1.95% | -5.68% |
| Bitcoin / Crypto | -0.13% z-0.4 | -0.66% | -1.10% | -0.92% | -2.08% |
| Semiconductors | -0.24% z-0.4 | -0.74% | -1.82% | -3.65% | +0.59% |
| China | -0.10% z-0.2 | -0.23% | +0.51% | -0.76% | -5.64% |
| Oil | -0.08% z-0.1 | -0.82% | -0.86% | -1.35% | -0.77% |
Data compiled by FactorPulse AI; edited and verified by Jeff Klein. For informational purposes only. Does not constitute financial advice, an investment recommendation, or an offer to buy or sell any securities. Always consult a qualified financial professional before making investment decisions.
For more on factor construction methodology, see www.factorpulse.com/glossary.