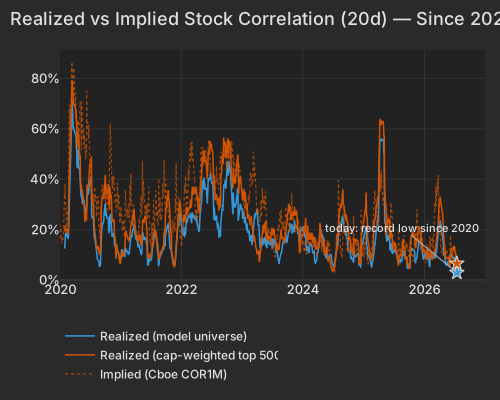
Strip the session to its variance and almost none of it is the index. Over the blended 20-day window the market factor accounts for 2.9% of cross-sectional variance — the record-low share since 2020 — while style factors carry 34% (94.0th percentile) and idiosyncratic moves most of the rest. That decomposition is why realized correlation collapsed to a record: when the index leg does nothing, stocks are left to trade their own stories. Both realized and implied correlation are pinned near record lows — the like-for-like large-cap realized series (spx500) reads 6.55% at the 3.3rd percentile, and Cboe COR1M, implied single-stock correlation across the top-50 names, printed 6.14, its lowest roughly 0.5% in twenty years. The one-day price of this regime is stark: index vol at 18.2 (53rd percentile) sitting beneath single-stock VIXEQ at 49.6 (98.3rd percentile).
| Series | Today Pct | Prev Close Pct |
|---|---|---|
| realized_model | 2.92 | 3.42 |
| realized_top500 | 6.55 | 7.19 |
| implied_cor1m |
| Factor | Return | Z-Score | 5d Z | 20d Z | 63d Z | Category | Direction |
|---|---|---|---|---|---|---|---|
| Beta | -0.73% | z=-0.7 | -2.4 | -2.2 | -0.0 | Style-Risk | High-beta lagged |
| Long-Term Momentum | +0.73% | z=+1.1 | -1.0 | -1.0 | +0.5 | Style-Momentum | 1-yr winners led |
| Hedge-Fund Ownership | -0.12% | z=-1.1 | +0.7 | +2.5 | -0.8 | Style-Positioning | Favored names slipped |
| Liquidity | +0.31% | z=+1.1 | -1.0 | -1.9 | -0.8 | Style | High-turnover led |
| Morning Activity | -0.17% | z=-1.3 | -0.2 | -0.4 | -1.7 | Style-Flow | Morning-heavy lagged |
| Treasury (Duration) | +0.32% | z=+0.9 | +1.4 | +0.5 | -0.5 | Thematic | Long-duration bid |
| Semiconductors | +0.43% | z=+0.7 | -1.1 | -1.5 | +0.1 | Thematic | Semis-exposed led today |
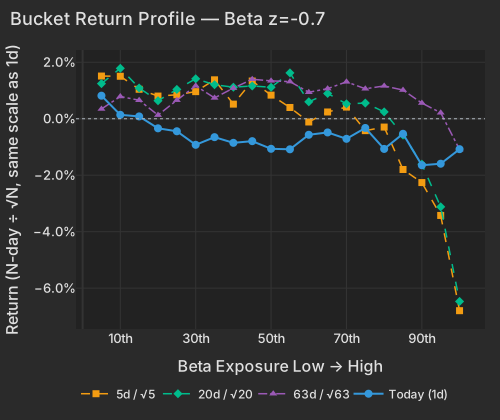
The churn under the calm surface has a clear author: Beta. It carries 21.6 vol points of the 20-day variance (96th percentile), the single largest style contributor, with Long-Term Momentum second at 11.6 points (95th percentile). Today's Beta return of -0.73% (z=-0.7) looks minor, but it sits on a five-day z=-2.4 and a 20-day drawdown of -9.69% in the high-exposure names — the most market-sensitive stocks have been sold every session for weeks. The bucket profile shows the same slope across horizons (Spearman -0.93 at five days, -0.81 at twenty), so this is a persistent de-risking, not a one-day air-pocket.
| Bucket | Ret 1D Pct | Ret 5D Norm Pct | Ret 20D Norm Pct | Ret 63D Norm Pct |
|---|---|---|---|---|
| 1 | 0.82 | 1.51 | 1.24 | 0.35 |
| 2 | 0.14 | 1.50 | 1.79 | 0.79 |
| 3 | 0.08 | 1.04 | 1.09 | 0.66 |
| 4 | -0.34 | 0.80 | 0.64 | 0.13 |
| 5 | -0.44 | 0.85 | 1.04 | 0.66 |
| 6 | -0.92 | 0.96 | 1.42 | 1.17 |
| 7 | -0.65 | 1.38 | 1.21 | 0.74 |
| 8 | -0.85 | 0.52 | 1.12 | 1.09 |
| 9 | -0.79 | 1.34 | 1.16 | 1.40 |
| 10 | -1.06 | 0.84 | 1.12 | 1.34 |
| 11 | -1.08 | 0.40 | 1.62 | 1.32 |
| 12 | -0.57 | -0.11 | 0.60 | 0.94 |
| 13 | -0.49 | 0.24 | 0.90 | 1.07 |
| 14 | -0.71 | 0.41 | 0.53 | 1.31 |
| 15 | -0.33 | -0.42 | 0.56 | 1.06 |
| 16 | -1.07 | -0.29 | 0.24 | 1.16 |
| 17 | -0.53 | -1.80 | -0.58 | 1.02 |
| 18 | -1.65 | -2.26 | -1.61 | 0.56 |
| 19 | -1.59 | -3.43 | -3.12 | 0.21 |
| 20 | -1.08 | -6.80 | -6.47 | -1.09 |
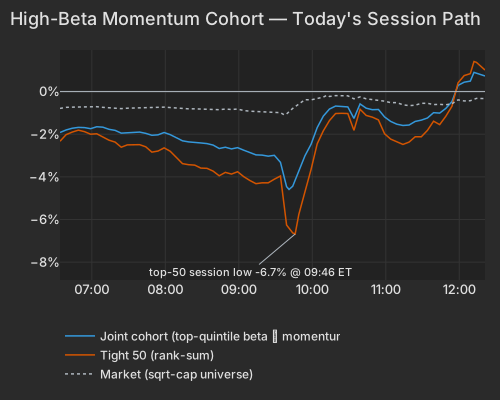
Watch it in the crowded names directly. The top-50 high-beta momentum cohort — market cap above $2B, top quintile on both beta and 12-month momentum, membership frozen at the month's first business day — is down -1.22%, on pace for its 443rd-worst session of 1,642 since 2020. That number hides the story: the group cratered to -6.68% by 09:46 before recovering to roughly -1.12%, versus -0.52% for everything outside the screen. Yesterday's flow evidence read as basket selling — members moved together at the 98th percentile of their 60-day norm — with the joint group also selling its most liquid names first, the fingerprint of deleveraging rather than a stock-by-stock verdict.
| Series | Ret Pct |
|---|---|
| joint | -0.84 |
| tight50 | -1.22 |
| market | -0.55 |
| rest | -0.52 |
One counter-current inside the style block: Long-Term Momentum actually paid today, up +0.73% (z=+1.1), with the best 1-year winners leading. The momentum axis has been the active fracture this month — the July 1 session was the sharpest long-term momentum drawdown since 2020 — but today it was Beta doing the selling, not momentum, and the crowded hedge-fund-favored names that had led over the past month (20-day z=+2.5) only gave a little back (z=-1.1).
The single-name dispersion that mechanically produces record-low correlation came straight from the earnings sheet. Intuitive Surgical was the largest stock-specific move in the universe, down -12.80% with essentially all of it its own move (idiosyncratic z -7.3); the company beat with Q2 EPS of $2.80 against a $2.51 consensus, but U.S. da Vinci procedure growth cooled to 12% and a device recall soured a high-multiple name into a broad growth markdown NYT. Fellow medical-device maker STAAR Surgical fell in sympathy, down -12.10%. Netflix, reported after yesterday's close, dropped -7.52% (idiosyncratic z -3.0) on a Q3 revenue guide of $12.86B that missed the $13.0B target and a decision to cut engagement disclosures NYT.
The other end was Travelers, up +8.19% and the largest positive own-move in the book (idiosyncratic z +8.7), after core EPS of $10.04 nearly doubled the $5.21 consensus on a 6.7-point improvement in the combined ratio and lighter catastrophe losses Barron's. Around them, the EDA software names caught the AI de-risking without a print of their own — Cadence -9.82% and Synopsys -8.27% — as Japan's Nikkei slid into a correction on fears the AI rally is overdone Bloomberg.
| Sector | Median Ret Pct |
|---|---|
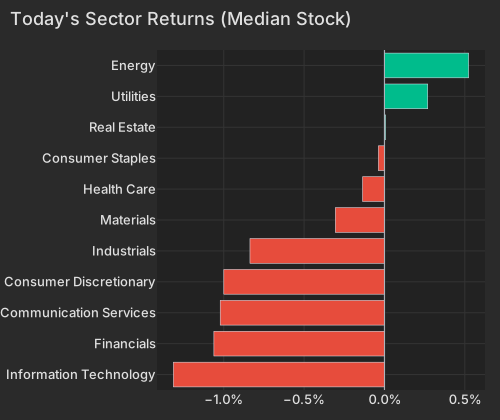
| Information Technology | -1.31 |
| Financials | -1.06 |
| Communication Services | -1.02 |
| Consumer Discretionary | -1.00 |
| Industrials | -0.84 |
| Materials | -0.31 |
| Health Care | -0.14 |
| Consumer Staples | -0.04 |
| Real Estate | 0.01 |
| Utilities | 0.27 |
| Energy | 0.52 |
The multi-week bleed that set up this correlation collapse is the AI-hardware sell-off. Semiconductors entered a bear market as the 105% AI-led run reversed, and 18 tech names have shed at least 30% in July alone BloombergMarketWatch. The newest pressure is Moonshot AI's Kimi K3, a 2.8-trillion-parameter open-weight model priced at $3 per million input tokens that undercuts Western rivals and reopened the question of hyperscaler capex durability Bloomberg. Leverage amplified the move in Korea, where single-stock leveraged ETFs on the chip trade forced retail liquidations Economic Times.
Note what the factor tape says about today, though: the Semiconductors factor was positive (+0.43%, z=+0.7) and the Roundhill Memory ETF bounced +3.65% — the semis complex caught a bid this session even as its 20-day picture (SMH -7.64%) stays broken. Today is the pause in the AI-hardware rotation, not a fresh leg down; the drawdown you are worried about already happened.
| ETF | Theme | Today | 1d Ago | 5d Ago | 20d Ago | 63d Ago |
|---|---|---|---|---|---|---|
| DRAM (2.4× vol) | memory chips | +3.65% | -8.82% | -18.68% | -23.16% | +51.84% |
| USO | oil | +3.00% | -1.71% | +9.44% | +3.32% | -2.68% |
| VXX | volatility | +3.79% | +2.88% | -0.60% | -4.96% | -26.87% |
| SMH | semiconductors | -1.35% | -3.70% | -6.39% | -7.64% | +25.59% |
| WGMI | crypto miners | -2.19% | -9.25% | -15.89% | -30.55% | +1.69% |
| MTUM | momentum | -0.15% | -2.96% | -5.54% | -6.94% | +12.38% |
| QQQ | large-cap growth | -1.06% | -1.64% | -2.40% | -3.28% | +10.75% |
| KWEB | china internet | -2.89% | +1.78% | +3.78% | +6.18% | -7.29% |
| SPY | large cap | -0.66% | -0.54% | -0.13% | +0.05% | +7.25% |
The strongest case against reading this as placid: the "calm" is one headline from breaking. VXX jumped +3.79%, VIX added 1.46 points to 18.2, and single-stock VIXEQ at 49.6 already prices chaos in the names — the options market is paying up for exactly the correlation spike that a record-low realized reading precedes. The high-beta group's -6.68% lurch at the open is a preview of how quickly this can re-correlate downward. Oil supplies the live catalyst risk: USO rose +3.00% on Middle East supply fears, and volatility is concentrating in the energy complex Bloomberg. Rates leaned the other way — the 10-year Treasury yield fell 3.2 bps to 4.54% on a flight-to-quality bid, with the long end down most CNBC, lifting the Treasury duration factor (+0.32%, z=+0.9). For a book running dispersion or short-correlation exposure, this is the moment to stress-test the beta and semis legs against a single macro shock.
The University of Michigan data.sca.isr.umich.edu preliminary consumer sentiment index, released at 10:00 AM ET, rose to 54.4 in July from 49.5 in June, well above the 51.0 consensus, with one-year inflation expectations cooling to 4.2% from 4.6%; survey director Joanne Hsu cautioned the gains may prove short-lived, as roughly 70% of responses preceded the July 7 U.S. strikes on Iran and the subsequent rebound in gasoline prices. The New York Fed Staff Nowcast newyorkfed.org publishes Fridays near 11:45 AM ET and has had Q3 growth tracking near 2.5%; managers also watch the Atlanta Fed's GDPNow and the Weekly Economic Index for high-frequency Q3 growth reads.
Variance decomposition: live intraday — 20260717 session, bracketed against its trailing-year range. Factor returns are trailing through last close. Total cross-sectional dispersion: 8.0%ile of the past year.
Variance mix — % of total, today vs 1d ago vs 1-yr avg
market 66%ile style 70%ile thematic 38%ile idiosyncratic 36%ile
Variance explained — today vs. factor's trailing-year range
Marker = the factor's share of today's total variance, placed in its own trailing-year range (box 25–75%ile, ticks 90%ile and max). Amber marker = unusually load-bearing today (≥90%ile of its own year). Factor name green = up today / red = down.
Correlation & dispersion — realized vs implied
Realized correlation (20d): 2.92% 0.0%ile record low since 2020
Top-500 realized: 6.55% 3.3%ile · implied (Cboe COR1M): 6.14 0.5%ile of its own history
Realized 20d vol (ann. pts): all stocks 47 vs VIXEQ 50 · index 8 vs VIX 18 · style factors 28 94.0%ile
Realized correlation = the market's share of cross-sectional variance (20-day, 19 completed days + today); percentiles vs model history since 2020. Implied prints (Cboe) are delayed ~15 min. as of 11:41 ET
Top 50 high-beta momentum names (eq-wt, since-2020 rank): -1.2% 27%ile · rest of market -0.5%
| Factor | Today | 1d | 5d | 20d | 60d |
|---|---|---|---|---|---|
| Style-Risk | |||||
| Beta | -0.73% z-0.8 | -3.02% | -5.01% | -8.16% | -1.19% |
| Residual Volatility | -0.18% z-0.4 | -0.78% | -1.92% | -1.48% | -1.37% |
| International | -0.07% z-0.2 | -0.28% | +0.24% | -0.28% | -2.20% |
| Style | |||||
| Liquidity | +0.31% z+1.1 | -0.71% | -1.04% | -3.26% | -1.92% |
| Dividend Yield | +0.16% z+0.8 | +0.05% | +0.15% | -1.02% | +0.90% |
| Profitability | -0.14% z-0.7 | +0.51% | +0.60% | -0.92% | -0.94% |
| Growth | -0.12% z-0.5 | -0.05% | -0.08% | +1.66% | +2.17% |
| Value | -0.10% z-0.4 | +0.37% | +0.68% | -1.22% | -0.84% |
| Leverage | +0.06% z+0.3 | +0.03% | -0.11% | -1.20% | -0.82% |
| Size | -0.05% z-0.1 | -0.32% | -0.08% | -0.60% | +1.88% |
| Style-Momentum | |||||
| Long-Term Momentum | +0.73% z+1.1 | -1.23% | -2.63% | -2.72% | +2.85% |
| One-Day Momentum | -0.22% z-0.7 | +0.10% | -0.48% | -0.50% | +2.50% |
| Short-Term Momentum | -0.20% z-0.6 | +0.08% | +0.03% | +0.04% | -1.89% |
| Medium-Term Momentum | -0.01% z-0.0 | +0.38% | +0.07% | +0.65% | +3.55% |
| Style-Positioning | |||||
| Hedge-Fund Ownership | -0.12% z-1.1 | +0.00% | +0.28% | +1.31% | -0.64% |
| Short Interest | -0.07% z-0.4 | +0.32% | +0.05% | +1.80% | +1.88% |
| Style-Flow | |||||
| Morning Activity | -0.17% z-1.3 | -0.17% | +0.02% | -0.23% | -1.58% |
| Short-Sale Activity | +0.08% z+0.7 | +0.22% | +0.20% | +0.19% | -0.42% |
| Thematic | |||||
| Treasury (Duration) | +0.32% z+0.9 | +0.28% | +0.95% | +0.58% | -1.68% |
| Semiconductors | +0.43% z+0.7 | -0.74% | -1.82% | -3.65% | +0.59% |
| China | -0.18% z-0.4 | -0.23% | +0.51% | -0.76% | -5.64% |
| Oil | +0.17% z+0.3 | -0.82% | -0.86% | -1.35% | -0.77% |
| Gold | +0.10% z+0.3 | -0.35% | -0.02% | -1.95% | -5.68% |
| Bitcoin / Crypto | +0.06% z+0.2 | -0.66% | -1.10% | -0.92% | -2.08% |
Data compiled by FactorPulse AI; edited and verified by Jeff Klein. For informational purposes only. Does not constitute financial advice, an investment recommendation, or an offer to buy or sell any securities. Always consult a qualified financial professional before making investment decisions.
For more on factor construction methodology, see www.factorpulse.com/glossary.