TSMC posted record Q2 results and the Nasdaq 100 sold off anyway, as the update revived doubts about how long current AI infrastructure spending can runBloomberg. In Seoul, the Financial Services Commission halted new single-stock leveraged ETF listings and tripled retail margin minimums to ₩30 million, knocking the KOSPI down roughly 6% with Samsung Electronics and SK Hynix leadingBloomberg. Both events aim at the same exposure — leveraged AI hardware — and J.P. Morgan reports hedge funds cutting TMT positions as leverage retreats from June's multi-year highsBloomberg.
| Factor | Return | Z-Score | 5d Z | 20d Z | 63d Z | Category | Direction |
|---|---|---|---|---|---|---|---|
| Beta | -3.11% | z=-3.2 | -2.3 | -1.9 | +0.0 | Style-Risk | Higher-beta names underperformed |
| Profitability | +0.51% | z=+2.6 | +1.4 | -1.1 | -0.5 | Style | More-profitable names outperformed |
| Liquidity | -0.65% | z=-2.2 | -1.5 | -2.5 | -0.8 | Style | Highest-turnover names lagged |
| Bitcoin / Crypto | -0.64% | z=-2.1 | -1.6 | -0.7 | -0.8 | Thematic | Crypto-linked names lagged |
| Long-Term Momentum | -1.21% | z=-1.9 | -1.8 | -0.9 | +0.5 | Style-Momentum | 12-month winners lagged |
| Semiconductors | -0.77% | z=-1.3 | -1.4 | -1.4 | +0.0 | Thematic | Semis-exposed names lagged |
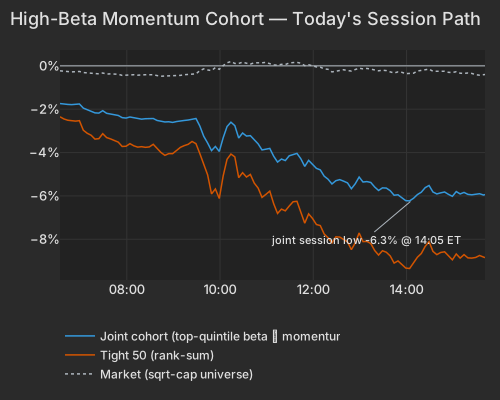
Beta was the day's fault line: -3.11% at z=-3.2, with the highest-beta bucket down -8.5% while the lowest-beta bucket rose. The joint high-beta momentum screen (192 names, cap > $2B, frozen July 1) fell -5.95%, ranked 19th-worst of 1,641 days since 2020; the top-50 rank-sum group fell -8.83%, 9th-worst. The rest of the universe — everything that clears neither screen — rose +1.18%, its 213th-best day since 2020. The group ground lower all session to a 14:05 trough of -6.26% on the joint screen and has barely lifted since.
| Series | Ret Pct |
|---|---|
| joint | -5.95 |
| tight50 | -8.83 |
| market | -0.41 |
| rest | 1.18 |
The flow evidence does not read as panic, and the disagreement is informative. Yesterday the group traded below the market's volume pace (markdown-flavored, not heavy turnover) and its internal co-movement was normal rather than basket-shaped — yet the selling ordered itself by liquidity, hitting the most liquid top-50 names hardest (-4.5% high-ADV tercile versus -1.15% low-ADV), and today the top-50 group is moving at 1.48× the joint screen against a 1.14× norm. Liquidity-first selling that scales with the beta-momentum characteristic itself is what a patient, systematic position-reduction program looks like, not a forced liquidation. The Liquidity factor (z=-2.2) agrees: the highest-turnover, most heavily optioned names fell -6.6% as a bucket while the sleepiest names were left alone.
Today extends a three-week break rather than starting one. Beta is -8.25% over 20 days but roughly flat (+0.35%) over 63 — the quarter's high-beta leadership has now been fully given back. Long-Term Momentum ran at the 94th percentile of its variance share since 2020 today, but this is a beta day, not a momentum inversion: Beta explained roughly 46% of the cross-sectional variance against Long-Term Momentum's ~6%, and the momentum hit is about half the size of the July 1 momentum break in factor-return terms, nowhere near vaccine-day 2020.
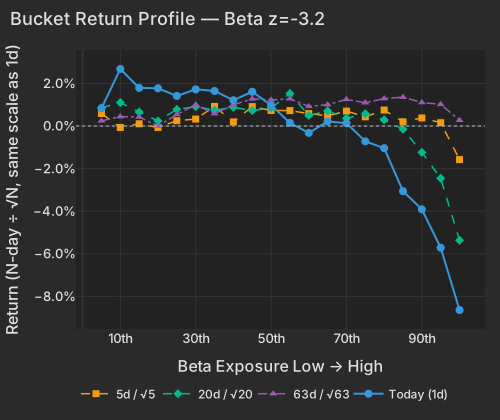
| Bucket | Ret 1D Pct | Ret 5D Norm Pct | Ret 20D Norm Pct | Ret 63D Norm Pct |
|---|---|---|---|---|
| 1 | 0.83 | 0.59 | 0.86 | 0.24 |
| 2 | 2.68 | -0.07 | 1.10 | 0.44 |
| 3 | 1.79 | 0.11 | 0.66 | 0.43 |
| 4 | 1.77 | -0.07 | 0.24 | -0.00 |
| 5 | 1.41 | 0.25 | 0.78 | 0.54 |
| 6 | 1.72 | 0.33 | 0.92 | 1.00 |
| 7 | 1.65 | 0.92 | 0.74 | 0.58 |
| 8 | 1.21 | 0.19 | 0.88 | 1.00 |
| 9 | 1.61 | 0.91 | 0.73 | 1.27 |
| 10 | 0.98 | 0.73 | 0.84 | 1.23 |
| 11 | 0.15 | 0.72 | 1.53 | 1.28 |
| 12 | -0.32 | 0.59 | 0.50 | 0.92 |
| 13 | 0.21 | 0.48 | 0.71 | 1.00 |
| 14 | 0.14 | 0.70 | 0.36 | 1.25 |
| 15 | -0.72 | 0.43 | 0.58 | 1.10 |
| 16 | -1.04 | 0.75 | 0.29 | 1.29 |
| 17 | -3.06 | 0.20 | -0.15 | 1.36 |
| 18 | -3.91 | 0.38 | -1.24 | 1.10 |
| 19 | -5.72 | 0.16 | -2.45 | 1.02 |
| 20 | -8.64 | -1.58 | -5.37 | 0.27 |
The check that matters before repeating the memory-chip story: Sandisk (SNDK) fell -12.3% with a style contribution of -12.1 points and a stock-specific move of just -0.2% — Beta alone accounts for -6.7 points. Seagate (STX, -10.1%) is the same shape, and AXT (AXTI, -14.8%) is nearly pure factor. The market is not repricing disk drives on new information today; it is selling the beta-momentum axis these names sit on. The fundamental memory story is real — CXMT opened its Shanghai IPO subscription at up to $9.8 billion with DRAM share at 9% of bit shipments, and US lawmakers urged a ban on Chinese memory chipsFinancial Times — but that story explains the 20-day trend (DRAM ETF -19.2%), not today's factor-shaped print. Even after all of it, DRAM is still +61.4% over 63 days. Korea proxy flows tell the same story from the ETF side: EWY fell -5.05% even as it draws record inflows as an SK Hynix access tradeBloomberg.
| ETF | Theme | Today | 1d Ago | 5d Ago | 20d Ago | 63d Ago |
|---|---|---|---|---|---|---|
| WGMI | crypto miners | -9.35% | +1.47% | -3.86% | -23.20% | +11.51% |
| DRAM | memory chips & storage | -8.88% | -6.26% | -7.48% | -19.23% | +61.37% |
| EWY | south korea | -5.05% | -3.02% | -6.06% | -18.83% | +17.02% |
| SMH | semiconductors | -3.84% | -1.59% | -0.38% | -8.71% | +30.70% |
| ARKK | innovation growth | -3.75% | +0.10% | -0.70% | -0.04% | +6.37% |
| MTUM | momentum | -3.09% | -2.22% | -0.69% | -6.28% | +15.66% |
| XLV | healthcare | +2.18% | +0.00% | -2.47% | +3.53% | +6.36% |
| IYR | real estate | +2.26% | +0.23% | +1.01% | +0.73% | +3.40% |
| KRE | regional banks | +2.63% | +1.04% | +3.33% | +4.91% | +9.37% |
| XLP | consumer staples | +2.71% | +0.06% | -1.09% | -2.35% | +2.45% |
Two adjacencies worth noting. The crypto complex sits on the same characteristic and took the same hit — Bitcoin/Crypto factor z=-2.1, WGMI -9.35%. Software, by contrast, was largely spared (IGV -0.30%) even after IBM's slide reignited AI-disruption fears across legacy enterprise names, with BlackBerry (BB) down 14%NYT. Alphabet (GOOGL) shed -4.47% — about $209 billion of market value — roughly half factor, half its own move.
All of this happened under an index that barely moved, and that contrast is now at an extreme: realized 20-day stock correlation printed 3.48%, a record low since 2020, because the market leg explains just 3.5% of cross-sectional variance (2nd percentile) while realized style volatility runs at 27.9 vol points, its 95th percentile — within reach of the April-2025 tariff-selloff levels — against realized index volatility of only 9 vol points. Today alone, style factors explained roughly 60% of the cross-section versus a 19% one-year average, with Beta doing most of that work. The options market is priced for this to persist: implied single-stock volatility (Cboe VIXEQ) at 49.4 sits in the top 2% of its history while VIX closed the gap only slightly at 16.98, implied dispersion (DSPX) at 46.3 is in its top 0.5%, and implied one-month single-stock correlation (Cboe COR1M) at 4.9 is in the lowest ~0.3% of its 20-year history — a divergence Bloomberg flags as fueling reverse-dispersion positioning Bloomberg. The practical implication for a book: index-level hedges priced off a 17-handle VIX are cheap precisely because they cover almost none of this — the risk is running through single names and style exposure, where implied vol is at stress levels.
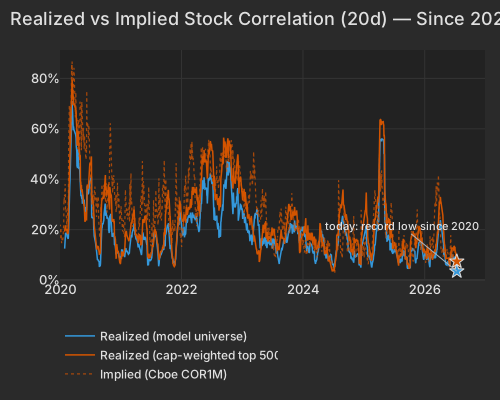
| Series | Today Pct | Prev Close Pct |
|---|---|---|
| realized_model | 3.48 | 3.64 |
| realized_top500 | 7.38 | 6.95 |
| implied_cor1m |
This was not risk-off — money moved within equities, not out of them. Profitability printed z=+2.6, and the shape matters: the move was driven by the least-profitable bucket falling -2.8%, meaning the market punished cash-burn rather than simply bidding quality. Real estate (IYR +2.26%), staples (XLP +2.71%), regional banks (KRE +2.63%) and healthcare (XLV +2.18%) absorbed the flows, and Value finished positive at z=+1.6.
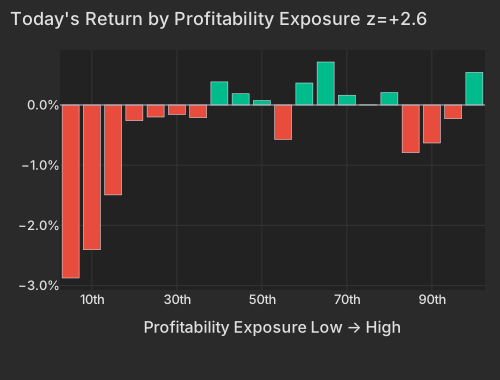
| Bucket | Avg Ret Pct |
|---|---|
| 1 | -2.87 |
| 2 | -2.40 |
| 3 | -1.49 |
| 4 | -0.26 |
| 5 | -0.20 |
| 6 | -0.16 |
| 7 | -0.21 |
| 8 | 0.38 |
| 9 | 0.19 |
| 10 | 0.07 |
| 11 | -0.57 |
| 12 | 0.37 |
| 13 | 0.71 |
| 14 | 0.16 |
| 15 | 0.00 |
| 16 | 0.21 |
| 17 | -0.79 |
| 18 | -0.63 |
| 19 | -0.23 |
| 20 | 0.54 |
Earnings reinforced the split. UnitedHealth (UNH, +1.5%) beat with adjusted EPS of $8.15 versus $7.92 expected and raised full-year guidance Bloomberg. Abbott (ABT) reported this morning and rose +10.5%, nearly all of it stock-specific — the largest such move in its trailing year. J.B. Hunt (JBHT) gained +7.9% on an intermodal-led beat CNBC, Prologis (PLD) added +4.1% after strong results and a guidance raise CNBC, and ManpowerGroup (MAN) ripped +32.6% — a 9-sigma idiosyncratic move — as a beat and raised guidance forced covering of short interest near 15% of float, a genuine squeeze Financial Times. Morgan Stanley (MS) was the exception that proves the mood: record profit on a 69% equities-trading surge Bloomberg, and the stock still fell -4.9%, mostly its own move.
The credit market is asking the same question as the equity tape. S&P cut Oracle to BBB-, one notch above junk, citing $90–95 billion of fiscal-2027 capex, a projected $42 billion free-cash-flow deficit, and OpenAI at roughly half of its $638 billion backlog Bloomberg, while New Mexico denied a gas-pipeline permit for a major Oracle data center Bloomberg. TSMC's capex signal, Seoul's leverage curbs, and a ratings agency balking at AI build-out math are three reads on one question — whether the spending is durable — and today the equity answer was to pay up for profitability and cut the leveraged expression. Energy stocks stayed firm (XOP +1.00%) as the reinstated U.S. blockade on Iran kept a supply risk under crude NYT, though USO gave back -1.68% of its +8.17% five-day run.
The macro data ran hot and rates edged up. June advance retail sales census.gov, released at 8:30 AM ET, rose 0.2% to $768.6 billion, matching consensus, with the GDP bea.gov-relevant control group up a stronger 0.5% CENSUS. Initial jobless claims the BLS, also at 8:30 AM ET, fell 8,000 to 208,000 — a 10-week low against consensus near 216,000–219,000 — with continuing claims down to 1.805 million. The Philadelphia Fed manufacturing survey surged to 41.4 versus a 12.7 forecast, its highest since November 2021, with prices paid still elevated at 53.9. The front end absorbed it: the two-year Treasury yield rose 2.8 bps to 4.16% and the ten-year 2.0 bps to 4.57% CNBC, while the dollar index firmed +0.28% to 100.77 CNBC. Netflix (NFLX), Elevance (ELV) and Cintas (CTAS) are among names in the earnings queue after today's close.
Variance decomposition: live intraday — 20260716 session, bracketed against its trailing-year range. Factor returns are trailing through last close. Total cross-sectional dispersion: 91%ile of the past year.
Variance mix — % of total, today vs 1d ago vs 1-yr avg
market 25%ile style 100%ile thematic 44%ile idiosyncratic 2%ile
Variance explained — today vs. factor's trailing-year range
Marker = the factor's share of today's total variance, placed in its own trailing-year range (box 25–75%ile, ticks 90%ile and max). Amber marker = unusually load-bearing today (≥90%ile of its own year). Factor name green = up today / red = down.
Correlation & dispersion — realized vs implied
Realized correlation (20d): 3.48% 0%ile record low since 2020
Top-500 realized: 7.38% 4%ile · implied (Cboe COR1M): 4.86 0%ile of its own history
Realized 20d vol (ann. pts): all stocks 48 vs VIXEQ 49 · index 9 vs VIX 17 · style factors 28 95%ile
Realized correlation = the market's share of cross-sectional variance (20-day, 19 completed days + today); percentiles vs model history since 2020. Implied prints (Cboe) are delayed ~15 min. as of 15:41 ET
High-beta momentum cohort (eq-wt, since-2020 ranks): joint -6.0% 1%ile worst since 2026-06-05 · tight50 -8.8% 0%ile · rest of market +1.2%
| Factor | Today | 1d | 5d | 20d | 60d |
|---|---|---|---|---|---|
| Style-Risk | |||||
| Beta | -3.11% z-3.2 | -0.42% | -0.38% | -6.10% | +2.06% |
| Residual Volatility | -0.77% z-1.5 | -0.51% | -1.02% | -1.73% | -0.17% |
| International | -0.21% z-0.7 | +0.32% | +0.45% | -0.13% | -2.07% |
| Style | |||||
| Profitability | +0.51% z+2.6 | -0.16% | +0.13% | -1.58% | -1.52% |
| Liquidity | -0.65% z-2.2 | -0.26% | -0.57% | -2.87% | -1.12% |
| Value | +0.38% z+1.6 | +0.02% | +0.43% | -1.38% | -1.04% |
| Size | -0.31% z-0.8 | +0.06% | +0.03% | -0.30% | +1.75% |
| Leverage | +0.06% z+0.3 | +0.06% | -0.25% | -1.19% | -0.92% |
| Dividend Yield | +0.05% z+0.2 | -0.23% | +0.08% | -1.25% | +0.93% |
| Growth | -0.03% z-0.1 | -0.03% | +0.05% | +1.86% | +2.20% |
| Style-Momentum | |||||
| Long-Term Momentum | -1.21% z-1.9 | -1.23% | -1.21% | -2.58% | +4.05% |
| Medium-Term Momentum | +0.38% z+1.3 | +0.20% | -0.15% | +0.17% | +3.23% |
| One-Day Momentum | +0.12% z+0.4 | -0.40% | -0.85% | -0.41% | +2.68% |
| Short-Term Momentum | +0.10% z+0.3 | -0.15% | -0.12% | +0.13% | -1.50% |
| Style-Positioning | |||||
| Short Interest | +0.27% z+1.5 | +0.15% | -0.35% | +1.40% | +1.65% |
| Hedge-Fund Ownership | -0.00% z-0.0 | +0.27% | +0.31% | +1.41% | -0.79% |
| Style-Flow | |||||
| Short-Sale Activity | +0.22% z+1.9 | +0.03% | -0.18% | -0.05% | -0.61% |
| Morning Activity | -0.12% z-0.9 | +0.22% | +0.13% | -0.08% | -1.30% |
| Thematic | |||||
| Bitcoin / Crypto | -0.64% z-2.1 | -0.22% | -0.54% | -0.54% | -1.36% |
| Oil | -0.77% z-1.5 | -0.66% | -0.27% | -1.42% | +0.35% |
| Semiconductors | -0.77% z-1.3 | -1.31% | -0.80% | -4.09% | +0.91% |
| Gold | -0.35% z-1.1 | +0.00% | +0.19% | -1.03% | -5.57% |
| Treasury (Duration) | +0.29% z+0.8 | +0.12% | +0.52% | +0.40% | -2.16% |
| China | -0.17% z-0.4 | +0.37% | +0.65% | -0.73% | -5.65% |
Data compiled by FactorPulse AI; edited and verified by Jeff Klein. For informational purposes only. Does not constitute financial advice, an investment recommendation, or an offer to buy or sell any securities. Always consult a qualified financial professional before making investment decisions.
For more on factor construction methodology, see www.factorpulse.com/glossary.