South Korea's move to halt new single-stock leveraged ETF listings is pulling leverage out of the chip complex, and the damage is landing hardest in memory: the Semiconductors factor is down z=-1.25, SMH -2.89%, and the memory basket DRAM -5.89%. Beta is down -0.96% (z=-0.98) and carrying most of those names lower. The move reads as high-beta deleveraging out of Asian chip exposure, not a fresh markdown of memory economics.
Seoul's regulators announced a moratorium on new single-stock leveraged ETF listings to curb retail speculation, and the KOSPI fell roughly 6% intraday, with Samsung Electronics and SK Hynix leading the decline and dragging the iShares MSCI South Korea ETF (EWY) down -3.00%.Bloomberg The channel into US chips is deleveraging out of high-beta Asian technology holdings, and the factor tape confirms the mechanism: Beta -0.96% (z=-0.98), Semiconductors -0.75% (z=-1.25), and Long-Term Momentum -0.56% (z=-0.86) all moving in the same direction as the market's biggest one-year winners give back ground.
| Factor | Return | Z-Score | 5d Z | 20d Z | 63d Z | Category | Direction |
|---|---|---|---|---|---|---|---|
| Semiconductors | -0.75% | z=-1.25 | -1.37 | -1.37 | 0.03 | Thematic | High-exposure lagged |
| Beta | -0.96% | z=-0.98 | -1.34 | -1.39 | 0.32 | Style-Risk | High-beta lagged |
| Long-Term Momentum | -0.56% | z=-0.86 | -1.34 | -0.70 | 0.59 | Style-Momentum | 1-yr winners lagged |
| Profitability | -0.19% | z=-0.97 | -0.22 | -1.87 | -0.96 | Style | Profitable lagged |
| Liquidity | -0.23% | z=-0.78 | -0.85 | -2.13 | -0.61 | Style | Low-turnover led |
| Residual Volatility | -0.16% | z=-0.33 | -1.16 | -0.38 | -0.08 | Style-Risk | Volatile lagged |
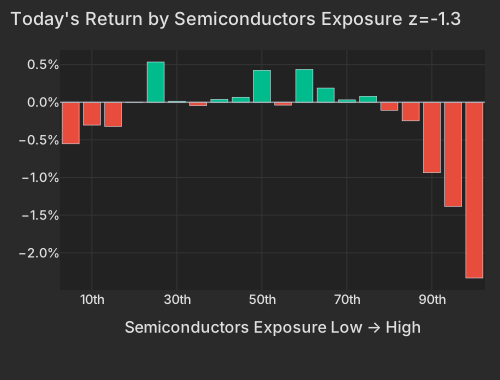
The cross-section is right-tail driven — the highest-Semiconductors-exposure bucket is off -2.33% while the low-exposure names are roughly flat, so this is the most-exposed cohort getting hit rather than a broad chip retreat.
| Bucket | Avg Ret Pct |
|---|---|
| 1 | -0.55 |
| 2 | -0.30 |
| 3 | -0.32 |
| 4 | -0.00 |
| 5 | 0.53 |
| 6 | 0.01 |
| 7 | -0.05 |
| 8 | 0.04 |
| 9 | 0.07 |
| 10 | 0.42 |
| 11 | -0.04 |
| 12 | 0.44 |
| 13 | 0.19 |
| 14 | 0.03 |
| 15 | 0.08 |
| 16 | -0.11 |
| 17 | -0.25 |
| 18 | -0.94 |
| 19 | -1.38 |
| 20 | -2.33 |
The headline blames intensifying Chinese DRAM competition, but the decomposition says almost none of the memory move is company-specific. Micron's -4.45% is carried by the day's beta complex with a slightly positive stock-specific residual; Western Digital -6.94% and Sandisk -7.13% are the same construction — factor contribution in the 86th–87th percentile of their own history, idiosyncratic components sitting near zero. These are among the market's largest one-year winners, so Long-Term Momentum pulling them lower is the recognized crash-prone tail after an extended run, not evidence the trend has changed. The fundamental backdrop in memory is, if anything, firming — which is precisely what makes today read as positioning being taken down rather than a reassessed view of the economics.
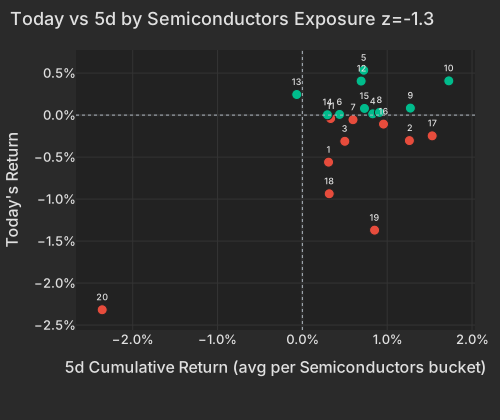
| Bucket | Ret 5D Pct | Today Ret Pct |
|---|---|---|
| 1 | 0.31 | -0.56 |
| 2 | 1.26 | -0.30 |
| 3 | 0.50 | -0.31 |
| 4 | 0.83 | 0.01 |
| 5 | 0.72 | 0.53 |
| 6 | 0.44 | 0.01 |
| 7 | 0.60 | -0.05 |
| 8 | 0.91 | 0.03 |
| 9 | 1.27 | 0.08 |
| 10 | 1.73 | 0.41 |
| 11 | 0.33 | -0.04 |
| 12 | 0.69 | 0.41 |
| 13 | -0.07 | 0.25 |
| 14 | 0.30 | 0.00 |
| 15 | 0.73 | 0.08 |
| 16 | 0.96 | -0.11 |
| 17 | 1.53 | -0.25 |
| 18 | 0.32 | -0.94 |
| 19 | 0.85 | -1.37 |
| 20 | -2.36 | -2.32 |
The ETF trend is the counterweight to the de-risking read, and it deserves to be stated plainly: DRAM is down -19.23% over 20 days yet still +61.37% over 63, and SMH sits +30.70% on the same window. A move this size against gains this large is consistent with leverage coming off a very extended winner — but the persistence of the 20-day drawdown is the real dissent to a pure positioning story, and a genuine supply threat from Chinese DRAM capacity would show up exactly this way. Beta explaining nearly 31% of today's cross-sectional variance — the top decile for that factor — is what tips the balance toward flows over fundamentals here.
| ETF | Theme | Today | 1d Ago | 5d Ago | 20d Ago | 63d Ago |
|---|---|---|---|---|---|---|
| DRAM | memory chips & storage | -5.89% | -6.26% | -7.48% | -19.23% | +61.37% |
| EWY | south korea | -3.00% | -3.02% | -6.06% | -18.83% | +17.02% |
| SMH | semiconductors | -2.89% | -1.59% | -0.38% | -8.71% | +30.70% |
| MTUM | momentum | -1.84% | -2.22% | -0.69% | -6.28% | +15.66% |
| XLK | technology | -1.42% | -1.11% | +0.10% | -5.32% | +22.74% |
| KWEB | china | +2.03% | +3.13% | +2.23% | +1.43% | -8.07% |
| XLV | healthcare | +1.03% | +0.00% | -2.47% | +3.53% | +6.36% |
Note the divergence at the bottom of the table: while Korea and semis lead the losses, Chinese internet (KWEB +2.03%) is bid — this is not a broad Asia-tech flush, it is specific to the leveraged-chip channel Seoul just squeezed.
Underneath the factor tape, a handful of earnings names are moving on their own merits and running opposite the de-risking. UnitedHealth surged +7.01% on a Q2 beat and raised full-year guidance, adding roughly $26bn in market value — the largest stock-specific move in its trailing year. JB Hunt jumped +7.77% on record intermodal volumes, a genuinely outsized company move (idiosyncratic z=4.87). The exceptions on the downside are just as name-specific: GE Aerospace fell -3.91% despite beating and lifting guidance, its move almost entirely stock-specific rather than factor-driven, and Kirby slid -4.94% after a Q2 miss on softer Gulf Coast barge demand.Bloomberg With the cash open still ahead, the style complex is already unusually load-bearing — style is carrying about 47% of cross-sectional variance against a 19% one-year norm — so expect these pre-open name stories to feed into the broader factor moves once liquidity arrives.
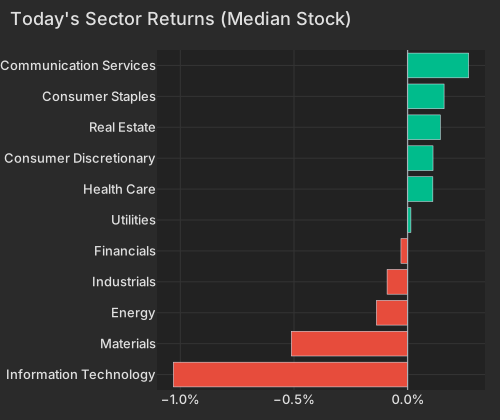
| Sector | Median Ret Pct |
|---|---|
| Information Technology | -1.03 |
| Materials | -0.51 |
| Energy | -0.14 |
| Industrials | -0.09 |
| Financials | -0.03 |
| Utilities | 0.01 |
| Health Care | 0.11 |
| Consumer Discretionary | 0.11 |
| Real Estate | 0.14 |
| Consumer Staples | 0.16 |
| Communication Services | 0.27 |
The rate backdrop reinforces the pressure on long-duration chip valuations: the 10-Year Treasury yield sits at 4.573%, up 2.8bps, with the long end leading — the 20-Year at 5.109% and 30-Year at 5.11% — a mild bear steepening that is no friend to high-beta growth.CNBC Oil is the notable non-confirmation: despite the reinstated US blockade on Iran and Brent holding above $84, USO is down -1.04% today after an +8.17% five-day run, so the geopolitical premium is being trimmed rather than extended.The New York Times The dollar is effectively flat (DXY 100.56, +0.08%), leaving today's story squarely a positioning one.
Three prints are due together at 8:30 AM ET. Advance Retail Sales census.gov is the marquee release, with the market watching whether high rates are finally curbing discretionary spending and testing the soft-landing narrative. Initial Jobless Claims the BLS are expected in the 210,000–220,000 range; a low print would reinforce the higher-for-longer rate read that is already pressuring Treasuries. The July Philadelphia Fed Manufacturing Survey is seen easing to roughly 7.0–9.5 from June's 10.3, with the Prices Paid sub-index the key risk for sticky-inflation watchers.
Variance decomposition: live intraday — 20260716 session, bracketed against its trailing-year range. Factor returns are trailing through last close. Total cross-sectional dispersion: 3%ile of the past year.
Variance mix — % of total, today vs 1d ago vs 1-yr avg
market 47%ile style 99%ile thematic 57%ile idiosyncratic 10%ile
Variance explained — today vs. factor's trailing-year range
Marker = the factor's share of today's total variance, placed in its own trailing-year range (box 25–75%ile, ticks 90%ile and max). Amber marker = unusually load-bearing today (≥90%ile of its own year). Factor name green = up today / red = down.
| Factor | Today | 1d | 5d | 20d | 60d |
|---|---|---|---|---|---|
| Style-Risk | |||||
| Beta | -0.97% z-1.0 | -0.42% | -0.38% | -6.10% | +2.06% |
| Residual Volatility | -0.17% z-0.3 | -0.51% | -1.02% | -1.73% | -0.17% |
| International | -0.09% z-0.3 | +0.32% | +0.45% | -0.13% | -2.07% |
| Style | |||||
| Profitability | -0.19% z-1.0 | -0.16% | +0.13% | -1.58% | -1.52% |
| Dividend Yield | -0.15% z-0.8 | -0.23% | +0.08% | -1.25% | +0.93% |
| Liquidity | -0.23% z-0.8 | -0.26% | -0.57% | -2.87% | -1.12% |
| Leverage | -0.11% z-0.6 | +0.06% | -0.25% | -1.19% | -0.92% |
| Size | -0.14% z-0.4 | +0.06% | +0.03% | -0.30% | +1.75% |
| Value | -0.06% z-0.3 | +0.02% | +0.43% | -1.38% | -1.04% |
| Growth | +0.05% z+0.2 | -0.03% | +0.05% | +1.86% | +2.20% |
| Style-Momentum | |||||
| Long-Term Momentum | -0.56% z-0.8 | -1.23% | -1.21% | -2.58% | +4.05% |
| Medium-Term Momentum | +0.17% z+0.6 | +0.20% | -0.15% | +0.17% | +3.23% |
| One-Day Momentum | +0.17% z+0.6 | -0.40% | -0.85% | -0.41% | +2.68% |
| Short-Term Momentum | +0.06% z+0.2 | -0.15% | -0.12% | +0.13% | -1.50% |
| Style-Positioning | |||||
| Hedge-Fund Ownership | +0.07% z+0.6 | +0.27% | +0.31% | +1.41% | -0.79% |
| Short Interest | +0.07% z+0.4 | +0.15% | -0.35% | +1.40% | +1.65% |
| Style-Flow | |||||
| Morning Activity | +0.08% z+0.6 | +0.22% | +0.13% | -0.08% | -1.30% |
| Short-Sale Activity | -0.03% z-0.3 | +0.03% | -0.18% | -0.05% | -0.61% |
| Thematic | |||||
| Semiconductors | -0.74% z-1.2 | -1.31% | -0.80% | -4.09% | +0.91% |
| Gold | +0.15% z+0.5 | +0.00% | +0.19% | -1.03% | -5.57% |
| Bitcoin / Crypto | -0.10% z-0.3 | -0.22% | -0.54% | -0.54% | -1.36% |
| China | +0.07% z+0.2 | +0.37% | +0.65% | -0.73% | -5.65% |
| Oil | -0.08% z-0.2 | -0.66% | -0.27% | -1.42% | +0.35% |
| Treasury (Duration) | -0.04% z-0.1 | +0.12% | +0.52% | +0.40% | -2.16% |
Data compiled by FactorPulse AI; edited and verified by Jeff Klein. For informational purposes only. Does not constitute financial advice, an investment recommendation, or an offer to buy or sell any securities. Always consult a qualified financial professional before making investment decisions.
For more on factor construction methodology, see www.factorpulse.com/glossary.