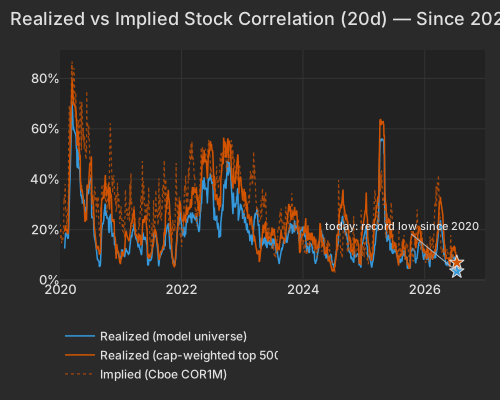
Realized stock correlation is at a record low since 2020 — 3.46% on a 20-day basis, 0th percentile — and the cause is mechanical: the cap-weighted index is barely moving (SPY -0.34%) while a violent high-beta sell-off runs underneath it. Beta is down -2.94% (z=-3.0), carrying roughly 47% of today's cross-sectional variance as money exits high-beta AI and semiconductor names and finds defensives. The calm headline hides one of the widest single-stock dispersions the model has ever printed.
The heaviest damage is in the most market-sensitive names, and it is almost entirely factor-carried. Each standard deviation of beta exposure cost about -2.13% today, and the stocks at the extreme moved like clockwork: AXTI -14.28%, Sandisk -11.57%, Bloom Energy -13.24% and POET -8.65% all show stock-specific residuals near zero — beta and, secondarily, Long-Term Momentum did the work, not any company news. The proximate trigger is Seoul: South Korea's Financial Services Commission moved to halt new listings of single-stock leveraged ETFs, deleveraging high-beta Korean tech and pulling the KOSPI down roughly 6% intraday.BloombergBloomberg The channel into US chips shows in Semiconductors -0.96% (z=-1.6) and in crypto proxies through Bitcoin -0.60% (z=-2.0), with the mining basket WGMI -9.50%.
| Factor | Return | Z-Score | 5d Z | 20d Z | 63d Z | Category | Direction |
|---|---|---|---|---|---|---|---|
| Beta | -2.94% | z=-3.0 | -2.25 | -1.84 | 0.07 | Style-Risk | High-beta lagged |
| Liquidity | -0.72% | z=-2.48 | -1.61 | -2.51 | -0.82 | Style | Low-turnover led |
| Bitcoin / Crypto | -0.60% | z=-2.0 | -1.55 | -0.64 | -0.82 | Thematic | Crypto-exposed lagged |
| Long-Term Momentum | -1.14% | z=-1.75 | -1.74 | -0.90 | 0.48 | Style-Momentum | 1-yr winners lagged |
| Semiconductors | -0.96% | z=-1.6 | -1.53 | -1.45 | -0.01 | Thematic | High-semis lagged |
| Profitability | +0.37% | z=1.89 | 1.06 | -1.23 | -0.60 | Style | Profitable led |
| Value | +0.38% | z=1.55 | 0.43 | -0.94 | -0.36 | Style | Cheap led |
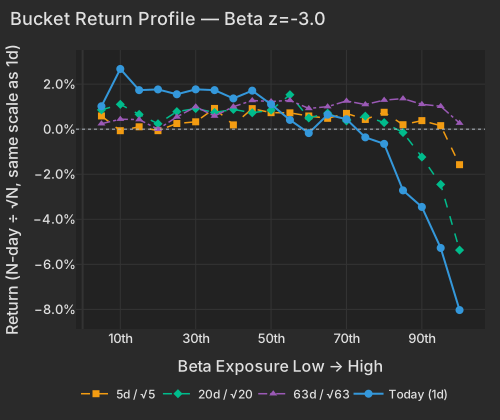
This is continuation, not a break. Beta's 20-day z of -1.84 and a -8.08% trailing-20-day return say the high-beta drawdown has been running for weeks; today is the sharpest single session inside it. The bucket profile confirms the structure — the top-beta bucket is off roughly -8.0% today, and the negative high-exposure slope holds across the 20-day horizon.
| Bucket | Ret 1D Pct | Ret 5D Norm Pct | Ret 20D Norm Pct | Ret 63D Norm Pct |
|---|---|---|---|---|
| 1 | 1.02 | 0.59 | 0.86 | 0.24 |
| 2 | 2.67 | -0.07 | 1.10 | 0.44 |
| 3 | 1.73 | 0.11 | 0.66 | 0.43 |
| 4 | 1.76 | -0.07 | 0.24 | -0.00 |
| 5 | 1.55 | 0.25 | 0.78 | 0.54 |
| 6 | 1.77 | 0.33 | 0.92 | 1.00 |
| 7 | 1.73 | 0.92 | 0.74 | 0.58 |
| 8 | 1.36 | 0.19 | 0.88 | 1.00 |
| 9 | 1.71 | 0.91 | 0.73 | 1.27 |
| 10 | 1.10 | 0.73 | 0.84 | 1.23 |
| 11 | 0.41 | 0.72 | 1.53 | 1.28 |
| 12 | -0.17 | 0.59 | 0.50 | 0.92 |
| 13 | 0.64 | 0.48 | 0.71 | 1.00 |
| 14 | 0.44 | 0.70 | 0.36 | 1.25 |
| 15 | -0.36 | 0.43 | 0.58 | 1.10 |
| 16 | -0.65 | 0.75 | 0.29 | 1.29 |
| 17 | -2.72 | 0.20 | -0.15 | 1.36 |
| 18 | -3.45 | 0.38 | -1.24 | 1.10 |
| 19 | -5.27 | 0.16 | -2.45 | 1.02 |
| 20 | -8.03 | -1.58 | -5.37 | 0.27 |
The AI-capex complex wears it worst, and the credit market is giving that a reason. AI power and data-center names sold off hard — AIPO -4.45%, URA -4.40%, DTCR -2.96% — with S&P's July 9 cut of Oracle to BBB- spglobal.com, one notch above junk, still weighing on the complex; the agency cited the cash-flow strain of its AI data-center build-out and OpenAI concentration in its $638B backlog.
The natural read is TSMC: record Q2 results and another AI-capex raise landing on "exceptionally high" expectations MarketWatch, with chip complexes selling off from Tokyo to New York. The decomposition disagrees about causality: TSM is off roughly -3.5%, but its factor complex accounts for -3.9% of the move — beta alone -3.2% — while the TSMC-specific residual is +0.6%. Priced on its own news, TSMC was a small positive today; the selling ran through the high-beta complex it anchors, which is what flow-driven de-risking looks like, not a verdict on AI demand.
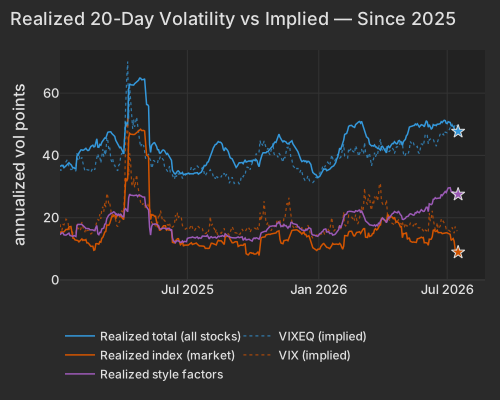
This is where the factor structure says something a price screen cannot. Total cross-sectional volatility sits at 47.7 vol points (79th percentile), but it is almost all style and stock-specific: the market leg is 8.9 vol points (2nd percentile) while the style leg is 27.5 (94th percentile). That is the definition of the record-low correlation — stocks are churning hard against each other, not with the index. Beta alone accounts for 33.8 vol points of it. The implied market agrees: index volatility (Cboe VIX) is a sleepy 16.36 while single-stock volatility (Cboe VIXEQ) is 48.76, near the 98th percentile of its own history, and both COR1M and COR3M single-stock correlation are pinned in the bottom ~0.2% of their 20-year range.
| Series | Today Pct | Prev Close Pct |
|---|---|---|
| realized_model | 3.46 | 3.64 |
| realized_top500 | 6.93 | 6.95 |
| implied_cor1m |
| Series | Today Vol Pts | Prev Close Vol Pts |
|---|---|---|
| total | 47.70 | 47.16 |
| market | 8.90 | 9.00 |
| style | 27.50 | 26.55 |
The Long-Term Momentum reading is the recognizable fault line inside this. One-year winners lagged one-year laggards (z=-1.75), the known crash-prone tail after an extended run rather than proof the trend is over; it extends the momentum unwind that began around July 1 and is still a fraction of a genuine vaccine-day crash in factor-return terms. For a PM the actionable read is that single-name risk is high even though the index looks anesthetized: VIXEQ near 48 with VIX at 16 is not a hedge you can buy cheaply at the index level.
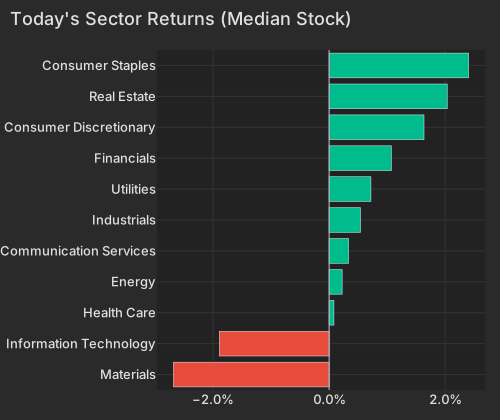
The offset that keeps the index flat is a clean defensive bid, and it is the strongest argument against reading today as broad risk-off. Profitability turned positive (z=+1.89) as profitable names outperformed, and the sector tape is the mirror image of the AI complex: staples +2.20%, real estate +1.90%, and consumer discretionary +1.44% at the median, with regional banks (KRE +2.99%) and healthcare (XLV +2.06%) bid. UnitedHealth rose +3.07% after a Q2 beat and a raised full-year EPS outlook, one of the larger stock-specific moves in its trailing year. Real estate rallying with the 10-year Treasury yield up 2.8 bps to 4.57% underlines that this is a rotation into safety, not a duration trade.CNBC
| Sector | Median Ret Pct |
|---|---|
| Materials | -2.68 |
| Information Technology | -1.89 |
| Health Care | 0.08 |
| Energy | 0.22 |
| Communication Services | 0.33 |
| Industrials | 0.54 |
| Utilities | 0.72 |
| Financials | 1.07 |
| Consumer Discretionary | 1.64 |
| Real Estate | 2.04 |
| Consumer Staples | 2.40 |
| ETF | Theme | Today | 1d Ago | 5d Ago | 20d Ago | 63d Ago |
|---|---|---|---|---|---|---|
| DRAM | memory chips & storage | -9.30% | -6.26% | -7.48% | -19.23% | +61.37% |
| EWY | south korea | -5.16% | -3.02% | -6.06% | -18.83% | +17.02% |
| SMH | semiconductors | -3.99% | -1.59% | -0.38% | -8.71% | +30.70% |
| MTUM | momentum | -3.11% | -2.22% | -0.69% | -6.28% | +15.66% |
| SPY | large cap | -0.34% | +0.40% | +1.26% | +0.00% | +8.69% |
| KRE | banking | +2.99% | +1.04% | +3.33% | +4.91% | +9.37% |
| XLP | consumer staples | +2.48% | +0.06% | -1.09% | -2.35% | +2.45% |
| XLV | healthcare | +2.06% | +0.00% | -2.47% | +3.53% | +6.36% |
| IYR | real estate | +1.85% | +0.23% | +1.01% | +0.73% | +3.40% |
Early earnings season winners ManpowerGroup ripped +34.08% and Abbott +10.94%. Cutting the other way, GE Aerospace fell -5.85% despite a Q2 beat as 130 bps of margin compression and cooling order growth outweighed raised guidance — an idiosyncratic loss, not part of the beta selling. A stronger dollar (DXY +0.32% to 100.81) added a headwind for the gold complex, where miners (GDX -3.48%) fell in with the high-beta right tail.CNBC
The honest tension: a record-low correlation with VIX at 16 argues the selling is orderly and confined, but VIXEQ near 48 and Beta carrying 47% of the variance say the single-name stress is real — if the defensive bid that is currently canceling it at the index level fades, there is nothing cosmetic left to hide behind.
Advance Retail Sales rose 0.2% census.gov in June, matching consensus expectations as a 0.5% increase in the control group signaled steady underlying demand despite a drag from gasoline prices. Concurrently, initial jobless claims unexpectedly fell to 208,000 dol.gov, beating the 216,000–219,000 estimate and reinforcing a resilient labor market narrative that supports a higher-for-longer interest rate path.
The Philadelphia Fed Manufacturing Index surged to a five-year high of 41.4 philadelphiafed.org in July, significantly outperforming the 12.7 consensus. With the prices paid sub-index remaining elevated at 53.9 and new orders jumping to 37.0, the data indicates robust regional momentum and persistent input cost pressures, driving Treasury yields and the dollar higher in immediate reaction.
Variance decomposition: live intraday — 20260716 session, bracketed against its trailing-year range. Factor returns are trailing through last close. Total cross-sectional dispersion: 87%ile of the past year.
Variance mix — % of total, today vs 1d ago vs 1-yr avg
market 8%ile style 100%ile thematic 45%ile idiosyncratic 2%ile
Variance explained — today vs. factor's trailing-year range
Marker = the factor's share of today's total variance, placed in its own trailing-year range (box 25–75%ile, ticks 90%ile and max). Amber marker = unusually load-bearing today (≥90%ile of its own year). Factor name green = up today / red = down.
Correlation & dispersion — realized vs implied
Realized correlation (20d): 3.46% 0%ile record low since 2020
Top-500 realized: 6.93% 4%ile · implied (Cboe COR1M): 4.47 0%ile of its own history
Realized 20d vol (ann. pts): all stocks 48 vs VIXEQ 49 · index 9 vs VIX 16 · style factors 28 94%ile
Realized correlation = the market's share of cross-sectional variance (20-day, 19 completed days + today); percentiles vs model history since 2020. Implied prints (Cboe) are delayed ~15 min. as of 12:58 ET
| Factor | Today | 1d | 5d | 20d | 60d |
|---|---|---|---|---|---|
| Style-Risk | |||||
| Beta | -2.94% z-3.0 | -0.42% | -0.38% | -6.10% | +2.06% |
| Residual Volatility | -0.70% z-1.4 | -0.51% | -1.02% | -1.73% | -0.17% |
| International | -0.27% z-0.9 | +0.32% | +0.45% | -0.13% | -2.07% |
| Style | |||||
| Liquidity | -0.72% z-2.5 | -0.26% | -0.57% | -2.87% | -1.12% |
| Profitability | +0.36% z+1.9 | -0.16% | +0.13% | -1.58% | -1.52% |
| Value | +0.38% z+1.6 | +0.02% | +0.43% | -1.38% | -1.04% |
| Size | -0.13% z-0.3 | +0.06% | +0.03% | -0.30% | +1.75% |
| Leverage | -0.06% z-0.3 | +0.06% | -0.25% | -1.19% | -0.92% |
| Dividend Yield | -0.05% z-0.3 | -0.23% | +0.08% | -1.25% | +0.93% |
| Growth | +0.02% z+0.1 | -0.03% | +0.05% | +1.86% | +2.20% |
| Style-Momentum | |||||
| Long-Term Momentum | -1.15% z-1.8 | -1.23% | -1.21% | -2.58% | +4.05% |
| Medium-Term Momentum | +0.40% z+1.4 | +0.20% | -0.15% | +0.17% | +3.23% |
| One-Day Momentum | +0.36% z+1.2 | -0.40% | -0.85% | -0.41% | +2.68% |
| Short-Term Momentum | +0.17% z+0.5 | -0.15% | -0.12% | +0.13% | -1.50% |
| Style-Positioning | |||||
| Short Interest | +0.28% z+1.6 | +0.15% | -0.35% | +1.40% | +1.65% |
| Hedge-Fund Ownership | +0.03% z+0.3 | +0.27% | +0.31% | +1.41% | -0.79% |
| Style-Flow | |||||
| Short-Sale Activity | +0.20% z+1.8 | +0.03% | -0.18% | -0.05% | -0.61% |
| Morning Activity | -0.12% z-0.9 | +0.22% | +0.13% | -0.08% | -1.30% |
| Thematic | |||||
| Bitcoin / Crypto | -0.60% z-2.0 | -0.22% | -0.54% | -0.54% | -1.36% |
| Semiconductors | -0.96% z-1.6 | -1.31% | -0.80% | -4.09% | +0.91% |
| Oil | -0.62% z-1.2 | -0.66% | -0.27% | -1.42% | +0.35% |
| Gold | -0.37% z-1.1 | +0.00% | +0.19% | -1.03% | -5.57% |
| Treasury (Duration) | +0.22% z+0.6 | +0.12% | +0.52% | +0.40% | -2.16% |
| China | -0.08% z-0.2 | +0.37% | +0.65% | -0.73% | -5.65% |
Data compiled by FactorPulse AI; edited and verified by Jeff Klein. For informational purposes only. Does not constitute financial advice, an investment recommendation, or an offer to buy or sell any securities. Always consult a qualified financial professional before making investment decisions.
For more on factor construction methodology, see www.factorpulse.com/glossary.