The supply threat is specific and it landed on a cohort priced for scarcity. CXMT opens public subscriptions tomorrow at a valuation near $35 billion, with proceeds earmarked for High Bandwidth Memory lines and analysts flagging 10–15% downside risk to mid-range DRAM spot prices by Q4Economic TimesNYT. The names most exposed to memory pricing took it directly: MU fell -10.85%, another -2.9% of that in the last hour, and the Roundhill Memory ETF (DRAM) dropped -9.50% — a fund that was still up +82.50% over the trailing 63 days. Korea, home of Samsung and SK Hynix, traded as the same story: EWY fell -5.77%, reversing yesterday's +5.33%.
What makes the session notable is that even good chip news couldn't hold a bid. ASML beat Q2 estimates and raised full-year 2026 revenue guidance to €43–45 billion from €36–40 billionEconomic Times — and still finished the morning down -2.10%. When a guidance hike of that size gets sold, the market is repricing the complex, not the company.
| Factor | Return | Z-Score | 5d Z | 20d Z | 63d Z | Category | Direction |
|---|---|---|---|---|---|---|---|
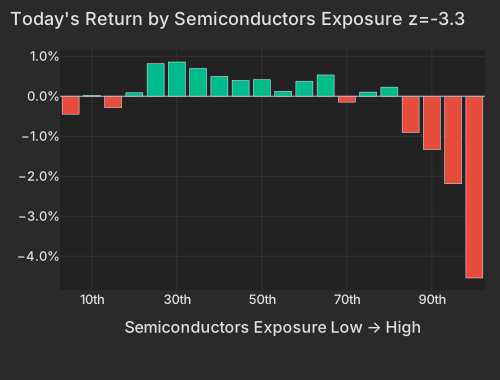
| Semiconductors | -1.94% | -3.25 | -1.07 | -1.77 | -0.21 | Thematic | Chip-exposed names lag broadly |
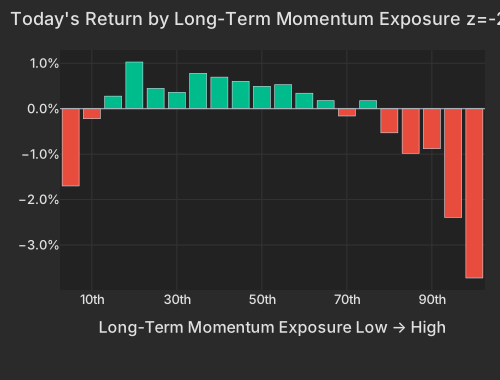
| Long-Term Momentum | -1.87% | -2.85 | -1.26 | -1.10 | +0.38 | Style-Momentum | 1-year winners sold vs laggards |
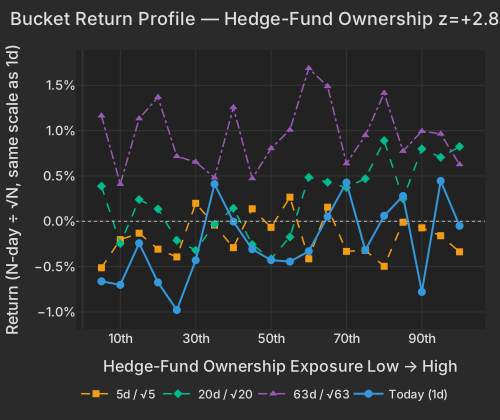
| Hedge-Fund Ownership | +0.31% | +2.77 | +1.41 | +2.88 | -0.56 | Positioning | HF favorites outperform again |
| Beta | -1.74% | -1.78 | -0.78 | -1.69 | +0.32 | Style-Risk | High-beta names underperform |
| Oil | -0.96% | -1.89 | -0.50 | -0.76 | -0.04 | Thematic | Oil-exposed names give back |
| Leverage | +0.05% | +0.27 | -0.61 | -1.43 | -0.71 | Style | Levered names hold in |
| Bucket | Avg Ret Pct |
|---|---|
| 1 | -0.45 |
| 2 | 0.02 |
| 3 | -0.28 |
| 4 | 0.09 |
| 5 | 0.81 |
| 6 | 0.86 |
| 7 | 0.69 |
| 8 | 0.50 |
| 9 | 0.40 |
| 10 | 0.41 |
| 11 | 0.12 |
| 12 | 0.38 |
| 13 | 0.53 |
| 14 | -0.15 |
| 15 | 0.10 |
| 16 | 0.23 |
| 17 | -0.90 |
| 18 | -1.33 |
| 19 | -2.19 |
| 20 | -4.55 |
Long-Term Momentum at z=-2.9 is this factor's known failure mode after an extended run — but the shape of today's move says something specific. The top decile of one-year winners is down -3.8% while the bottom-decile laggards are also down -1.74%. That is not laggards ripping higher against a stale short book — it is concentrated selling of the winners themselves, consistent with profit-taking on the memory and AI-hardware trade triggered by a genuine supply headline rather than a mechanical positioning flush.
| Bucket | Avg Ret Pct |
|---|---|
| 1 | -1.70 |
| 2 | -0.22 |
| 3 | 0.28 |
| 4 | 1.03 |
| 5 | 0.45 |
| 6 | 0.36 |
| 7 | 0.78 |
| 8 | 0.70 |
| 9 | 0.60 |
| 10 | 0.49 |
| 11 | 0.53 |
| 12 | 0.34 |
| 13 | 0.18 |
| 14 | -0.16 |
| 15 | 0.18 |
| 16 | -0.53 |
| 17 | -0.98 |
| 18 | -0.88 |
| 19 | -2.39 |
| 20 | -3.73 |
The decomposition makes the point cleanly. Micron's -10.85% carries an -8.7% style component against a stock-specific move of less than one percent — the largest factor-carried day in its trailing year. Sandisk (SNDK) at -15.37% and Applied Optoelectronics (AAOI) at -14.96% show the same fingerprint: big headline moves, minimal idiosyncratic content, Long-Term Momentum the factor doing the carrying. Dell (DELL), -14.05%, splits roughly evenly between its momentum exposure and its own move. When one headline hits an entire exposure cohort at once, it prints as a factor event — and that is exactly what CXMT did. MTUM, the momentum ETF, is down -3.63% at 2.9× the typical ETF pace, the heaviest relative volume in the fund universe today.
The trend context argues against calling this a durable break. SMH is still +3.24% over five days and +35.41% over 63; MTUM is +20.19% over the same window; Long-Term Momentum's 63-day z is a benign +0.38. Rates are helping, not hurting: the ten-year Treasury yield sits at 4.55%, down 3 bps on the day, with the two-year off 5 bpsCNBC. Today reads as a violent one-day mark-down of memory-pricing assumptions inside an intact uptrend — the risk worth watching is whether DRAM spot forecasts follow through.
| ETF | Theme | Today | 1d Ago | 5d Ago | 20d Ago | 63d Ago |
|---|---|---|---|---|---|---|
| DRAM | memory chips & storage | -9.50% | +6.86% | +1.06% | -5.81% | +82.50% |
| EWY | south korea | -5.77% | +5.33% | -2.38% | -10.37% | +25.31% |
| SMH | semiconductors | -4.05% | +2.51% | +3.24% | -3.17% | +35.41% |
| MTUM | momentum | -3.63% | +1.63% | +2.34% | -1.43% | +20.19% |
| XLK | technology | -2.67% | +1.29% | +2.48% | -0.64% | +26.10% |
| KWEB | china | +3.62% | -0.19% | +2.63% | -1.17% | -8.84% |
| XLC | communication services | +1.89% | -0.13% | +0.39% | -0.18% | -2.94% |
| XLF | financials | +0.79% | +0.20% | +0.23% | +5.32% | +8.75% |
The index is flat because the money leaving memory chips found somewhere to go. Apple rose +4.13% to a record — a 98th-percentile day for the stock, with +3.5% of it stock-specific — after China's cyberspace regulator registered Apple Intelligence for domestic launch on Baidu and Alibaba model integrations. Alphabet (GOOG) added +3.93%, Alibaba (BABA) +5.58%, and KWEB gained +3.62% on the same clearance plus strong June China export data. And PayPal jumped +15.95% on a $53.4 billion, $60.50-per-share cash bid from Stripe and Advent International, with the board set to meet as early as July 20CNBCFT — a +13.9% idiosyncratic move, the largest in the stock's trailing year.
This is why the variance mix is the day's quietest important number: the Market factor explains 1.0% of cross-sectional variance against a one-year average of 9.9%, while style factors explain 43.3% against a 19.4% norm. Correlation across stocks has collapsed — names are trading their own exposures and their own news, which is precisely the environment where a factor event this large can hide under a flat S&P 500.
Beneath it, Hedge-Fund Ownership is the counter-signal that separates this from a positioning rout. The most hedge-fund-owned names outperformed again, +0.31% at z=+2.8 today on top of a 20-day z=+2.9 — a month-long run of continuation, extending right through a session that punished the momentum complex. Whatever is being sold today, it is the memory-pricing exposure, not the crowded institutional book broadly. A momentum drawdown that leaves hedge-fund favorites untouched argues for a targeted fundamental reassessment rather than forced selling.
| Bucket | Ret 1D Pct | Ret 5D Norm Pct | Ret 20D Norm Pct | Ret 63D Norm Pct |
|---|---|---|---|---|
| 1 | -0.66 | -0.51 | 0.39 | 1.16 |
| 2 | -0.70 | -0.20 | -0.25 | 0.41 |
| 3 | -0.24 | -0.13 | 0.24 | 1.13 |
| 4 | -0.67 | -0.31 | 0.14 | 1.37 |
| 5 | -0.98 | -0.39 | -0.21 | 0.72 |
| 6 | -0.43 | 0.20 | -0.32 | 0.65 |
| 7 | 0.41 | -0.04 | -0.03 | 0.48 |
| 8 | -0.00 | -0.29 | 0.14 | 1.26 |
| 9 | -0.31 | 0.14 | -0.25 | 0.47 |
| 10 | -0.43 | -0.07 | -0.41 | 0.80 |
| 11 | -0.44 | 0.27 | -0.17 | 1.01 |
| 12 | -0.33 | -0.41 | 0.49 | 1.69 |
| 13 | 0.05 | 0.16 | 0.43 | 1.49 |
| 14 | 0.43 | -0.33 | 0.37 | 0.64 |
| 15 | -0.32 | -0.32 | 0.47 | 0.95 |
| 16 | 0.06 | -0.50 | 0.89 | 1.41 |
| 17 | 0.28 | -0.01 | 0.25 | 0.77 |
| 18 | -0.78 | -0.07 | 0.80 | 0.99 |
| 19 | 0.45 | -0.16 | 0.71 | 0.96 |
| 20 | -0.05 | -0.34 | 0.82 | 0.63 |
Two single-name stories round out the damage away from chips. Progressive (PGR) fell -7.84% — a -9.5% stock-specific move against a factor complex that would have had it up — after Q2 EPS of $1.85 missed the $2.10 consensus on catastrophe losses and a combined ratio that deteriorated to 92.5% from 90.1%Bloomberg; Elevance's benefit expense ratio jumping to 86.3% from 84.8% spread the medical-cost worry across the groupthe SEC. Pentair (PNR) dropped -16.78%, essentially all its own move and the deepest stock-specific decline in its trailing year, after the company cut full-year guidance on pool-channel destocking and announced a CFO transition; pool peer Hayward (HAYW) fell -7.72% in sympathy.
Where to look in the book: memory and momentum overlap — MU, SNDK, DELL, the DRAM and MTUM ETFs, and Korea via EWY — is where today's damage concentrates; SMH and XLK for whether the broader chip complex stabilizes; KWEB and FXI for the China-approval bid; XLF and KRE (+1.37%) for the quieter strength in financials that the CXMT story has nothing to do with.
NY Fed President Williams, speaking at 8:45 AM ET, said inflation near 4% remains too high but has likely peaked, called the 3.5–3.75% policy rate "well positioned," and market-implied odds of a 2026 rate hike slipped from 66% to 50.5% after the remarks; the July Empire State Manufacturing Index printed 15.6 against an 8.8 consensus. Fed Chair Warsh, in Senate Banking testimony at 10:00 AM ET, argued AI infrastructure spending may cause temporary price spikes without fueling structural inflation — read by the market as mildly dovish, consistent with the 3–5 bp decline across the front of the Treasury curveCNBC.
Variance decomposition: live intraday — 20260715 session, bracketed against its trailing-year range. Factor returns are trailing through last close. Total cross-sectional dispersion: 79%ile of the past year.
Variance mix — % of total, today vs 1d ago vs 1-yr avg
market 25%ile style 97%ile thematic 88%ile idiosyncratic 12%ile
Variance explained — today vs. factor's trailing-year range
Marker = the factor's share of today's total variance, placed in its own trailing-year range (box 25–75%ile, ticks 90%ile and max). Amber marker = unusually load-bearing today (≥90%ile of its own year). Factor name green = up today / red = down.
| Factor | Today | 1d | 5d | 20d | 60d |
|---|---|---|---|---|---|
| Style-Risk | |||||
| Beta | -1.74% z-1.8 | +1.37% | +0.39% | -3.10% | +3.94% |
| Residual Volatility | -0.72% z-1.4 | -0.18% | +0.03% | -0.99% | -0.54% |
| Style | |||||
| Dividend Yield | -0.32% z-1.7 | +0.27% | +0.47% | -1.19% | +1.10% |
| Liquidity | -0.24% z-0.8 | -0.03% | +0.23% | -2.31% | -1.22% |
| Profitability | -0.15% z-0.8 | -0.16% | +0.48% | -1.39% | -1.16% |
| Leverage | +0.05% z+0.3 | -0.07% | -0.26% | -1.31% | -0.92% |
| Value | +0.03% z+0.1 | -0.19% | +0.44% | -1.46% | -0.96% |
| Growth | -0.03% z-0.1 | +0.19% | +0.19% | +2.27% | +2.30% |
| Size | -0.01% z-0.0 | +0.01% | +0.30% | +0.29% | +1.42% |
| international | +0.27% | -0.05% | +0.42% | -0.64% | -2.63% |
| Style-Momentum | |||||
| Long-Term Momentum | -1.87% z-2.9 | +0.66% | +1.05% | -1.49% | +4.50% |
| Medium-Term Momentum | +0.51% z+1.7 | -0.14% | -1.11% | -0.23% | +3.34% |
| One-Day Momentum | -0.52% z-1.7 | -0.06% | -0.55% | +0.14% | +2.49% |
| Short-Term Momentum | -0.23% z-0.7 | +0.07% | -0.76% | +0.02% | -1.79% |
| Style-Positioning | |||||
| Hedge-Fund Ownership | +0.31% z+2.8 | +0.03% | +0.11% | +1.22% | -0.89% |
| Short Interest | +0.26% z+1.4 | -0.26% | -0.63% | +1.39% | +1.57% |
| Style-Flow | |||||
| Morning Activity | +0.11% z+0.7 | -0.06% | -0.15% | -0.48% | -1.67% |
| Short-Sale Activity | +0.05% z+0.4 | -0.13% | -0.30% | -0.32% | -0.52% |
| Thematic | |||||
| Semiconductors | -1.94% z-3.2 | +0.46% | +1.85% | -2.59% | +2.24% |
| Oil | -0.96% z-1.9 | +0.25% | +1.73% | -1.25% | -0.85% |
| Bitcoin / Crypto | -0.28% z-0.9 | +0.19% | -0.13% | +0.13% | -1.25% |
| China | +0.35% z+0.9 | -0.03% | +0.58% | -1.04% | -5.98% |
| Gold | -0.08% z-0.2 | +0.08% | -0.17% | -0.72% | -5.42% |
| Treasury (Duration) | +0.00% z+0.0 | +0.12% | +0.15% | -0.23% | -2.20% |
Data compiled by FactorPulse AI; edited and verified by Jeff Klein. For informational purposes only. Does not constitute financial advice, an investment recommendation, or an offer to buy or sell any securities. Always consult a qualified financial professional before making investment decisions.
For more on factor construction methodology, see www.factorpulse.com/glossary.