IBM fell -21.35% on a preliminary Q2 miss — revenue of $17.2B against a $17.86B consensus — with CEO Arvind Krishna conceding "we faltered" as clients curbed discretionary software and consulting spend.BloombergWSJ The mechanism matters more than the number: management pinned the shortfall on late-June client reprioritization of capex toward supply-constrained servers, memory and storage. That is not a company problem — it is a demand-side sourcing change, and it explains why the same session that buried software lifted memory chips. The move is almost entirely the stock's own: an idiosyncratic component near the 100th percentile of its trailing year (idio_z −7.5), erasing roughly $59B of market value, with the day's factor complex contributing almost nothing.
The read-through is spreading through IT services rather than staying contained — Cognizant (CTSH) is down -7.46% on its own move, and the software ETF's -3.54% stands out against its +24.15% run over the prior 63 days. Software isn't giving back a long trend; it is being marked down on this specific print.
| Factor | Return | Z-Score | 5d Z | 20d Z | 63d Z | Category | Direction |
|---|---|---|---|---|---|---|---|
| Semiconductors | +1.15% | z=+1.9 | +1.9 | -0.7 | +0.3 | Thematic | High-exposure chips led |
| Dividend Yield | +0.30% | z=+1.6 | +1.3 | -1.4 | +0.8 | Style | Higher payout led |
| Beta | +1.53% | z=+1.6 | +0.3 | -0.7 | +0.7 | Style-Risk | Market-sensitive led |
| Long-Term Momentum | +0.97% | z=+1.5 | +0.9 | -0.4 | +0.8 | Style-Momentum | 1-yr winners led |
| Medium-Term Momentum | -0.41% | z=-1.4 | -2.2 | -0.4 | +1.1 | Style-Momentum | 1-mo winners gave back |
| Short Interest | -0.25% | z=-1.4 | -2.0 | +2.0 | +1.9 | Style-Positioning | Most-shorted lagged, no squeeze |
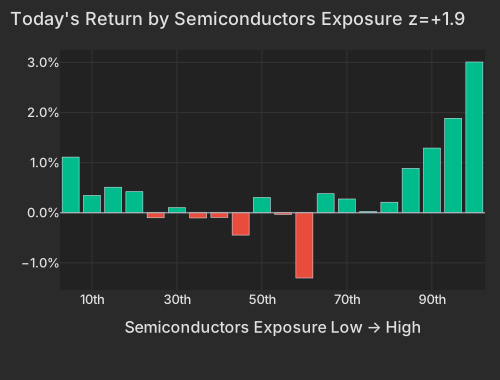
The memory side of the shift shows up in the highest-exposure Semiconductors names outperforming, a right-tail move — the top exposure bucket is up +2.9%. Micron (MU) rose +5.58%, SanDisk (SNDK) +7.16%, Texas Instruments (TXN) +5.07%, and the Roundhill Memory ETF (DRAM) jumped +5.54%. Memory stocks are stabilizing after a roughly 20% correction, helped by news that ChangXin Memory (CXMT) confirmed a July 27 Shanghai debut — Asia's biggest IPO of 2026 — as investors buy the dip.Economic Times
| Bucket | Avg Ret Pct |
|---|---|
| 1 | 1.11 |
| 2 | 0.35 |
| 3 | 0.51 |
| 4 | 0.42 |
| 5 | -0.10 |
| 6 | 0.10 |
| 7 | -0.10 |
| 8 | -0.09 |
| 9 | -0.45 |
| 10 | 0.31 |
| 11 | -0.03 |
| 12 | -1.30 |
| 13 | 0.38 |
| 14 | 0.28 |
| 15 | 0.02 |
| 16 | 0.21 |
| 17 | 0.89 |
| 18 | 1.29 |
| 19 | 1.89 |
| 20 | 3.01 |
Here is the residual that the headline hides: the software repricing is genuinely stock-specific, but the memory rally is being amplified by the day's beta bid rather than pure demand buying. Both MU and SNDK decompose as factor-driven, carried by the Beta complex (top-decile beta names +3.3%) — their own stock-specific move is roughly zero. Beta itself is up +1.53% at z=+1.56, right-tail led by AI and data-center names like POET, WOLF and AEHR. So a PM should trust the software signal as information and discount part of the chip move as risk-appetite beta — the cleanest idiosyncratic confirmation of the capex story on the memory side is Tower Semiconductor (TSEM), up +19.78%, and even that is its own Japan grant story ($3B expansion, ~$1B government support), not a read-through from IBM.Bloomberg
DRAM's +5.54% also needs its context: it sits on a +76.69% gain over the prior 63 days but -12.01% over the last 20, so today is a bounce inside an intact memory supercycle, not a fresh breakout. The macro tailwind arrived with a cool CPI: high-beta, high-momentum, and high-dividend cohorts all firmed together as rate-hike fear drained out.
| ETF | Theme | Today | 1d Ago | 5d Ago | 20d Ago | 63d Ago |
|---|---|---|---|---|---|---|
| DRAM | memory chips | +5.54% | -9.11% | -11.52% | -12.01% | +76.69% |
| SMH | semiconductors | +3.83% | -4.16% | -3.09% | -3.91% | +34.05% |
| GDX | gold miners | +3.87% | -2.86% | -6.82% | -5.60% | -26.18% |
| USO | oil | +2.98% | +8.36% | +12.88% | -8.57% | -5.63% |
| MTUM | momentum | +2.81% | -2.22% | -2.20% | -1.37% | +19.43% |
| QQQ | large-cap growth | +1.09% | -1.90% | -1.53% | -0.75% | +16.47% |
| XLF | financials | -0.32% | +0.65% | -0.12% | +6.56% | +10.44% |
| IGV | software | -3.54% | +0.31% | -2.20% | +1.96% | +24.15% |
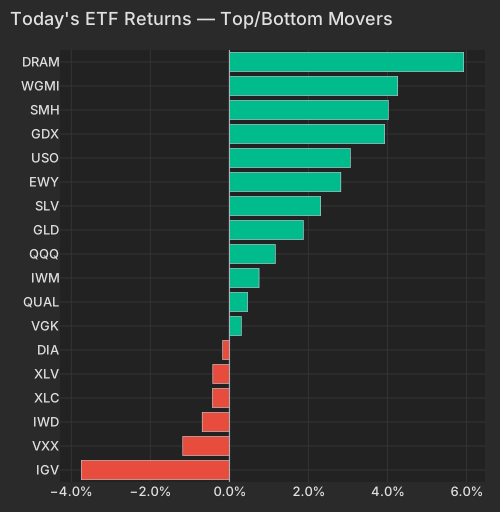
| Sym | Theme | Ret Today Pct | Vol Pace |
|---|---|---|---|
| IGV | cyclical | -3.75 | 0.67 |
| VXX | uncertainty | -1.18 | 0.32 |
| IWD | value | -0.69 | 0.00 |
| XLC | technology | -0.43 | 0.01 |
| XLV | defensive | -0.42 | 0.03 |
| DIA | size | -0.17 | 0.58 |
| VGK | international | 0.30 | 0.75 |
| QUAL | quality | 0.46 | 0.95 |
| IWM | size | 0.75 | 0.51 |
| QQQ | growth | 1.16 | 0.48 |
| GLD | currency | 1.87 | 0.83 |
| SLV | currency | 2.31 | 0.82 |
| EWY | international | 2.82 | 0.87 |
| USO | energy + cyclical | 3.06 | 1.62 |
| GDX | currency | 3.93 | 0.65 |
| SMH | technology | 4.02 | 0.30 |
| WGMI | retail + currency | 4.26 | 0.25 |
| DRAM | technology | 5.93 | 1.67 |
June headline CPI slowed to 3.5% against a 3.8% consensus, with gasoline down 9.7% and core cooling to 2.6%, cutting July Fed hike odds to roughly 20%.Bloomberg The curve moved accordingly: the 10-Year eased to 4.573%, down 3.7 bps, while the front end fell harder — the 2-Year down 7.2 bps and the 1-Year down 8.7 bps — a dovish steepening that let duration-sensitive winners and Long-Term Momentum (+0.97%, z=+1.49) firm.CNBC The dollar softened in step, with DXY down -0.52% to 100.71, a tailwind that helped gold miners (GDX +3.87%) despite bullion's poor 63-day tape.CNBC
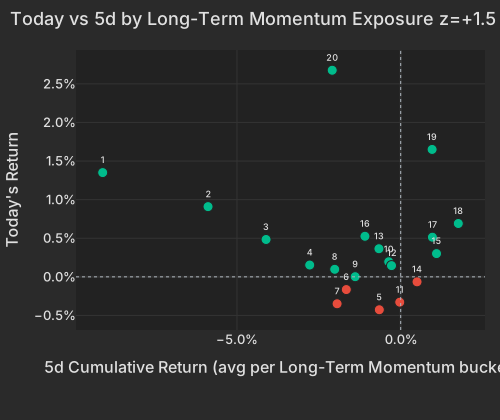
| Bucket | Ret 5D Pct | Today Ret Pct |
|---|---|---|
| 1 | -9.10 | 1.35 |
| 2 | -5.88 | 0.91 |
| 3 | -4.11 | 0.48 |
| 4 | -2.78 | 0.15 |
| 5 | -0.65 | -0.43 |
| 6 | -1.66 | -0.16 |
| 7 | -1.94 | -0.35 |
| 8 | -2.01 | 0.10 |
| 9 | -1.39 | 0.00 |
| 10 | -0.36 | 0.20 |
| 11 | -0.03 | -0.33 |
| 12 | -0.28 | 0.15 |
| 13 | -0.66 | 0.36 |
| 14 | 0.50 | -0.06 |
| 15 | 1.10 | 0.30 |
| 16 | -1.09 | 0.53 |
| 17 | 0.97 | 0.51 |
| 18 | 1.76 | 0.69 |
| 19 | 0.96 | 1.65 |
| 20 | -2.09 | 2.68 |
The bank print is the counterweight to the risk-on read. Goldman Sachs (GS) surged +3.77% on a record $20.98 EPS and a 53% jump in banking revenue,Bloomberg yet JPMorgan slipped -1.55% as a $2.5B expense-guidance hike overshadowed a record profit,NYT and the financials ETF is net negative at -0.32%. Record results are not translating into sector strength — a fact worth weighing against the broad-relief interpretation of the day.
Two more single-name shocks fit the same fundamental-repricing pattern rather than any flow story: Ericsson (ERIC) fell -9.51% on a Q2 miss and a cut to full-year guidance as 5G capex budgets exhausted, and HCA Healthcare dropped -9.01% on a labor-cost-driven guidance cut — both large, stock-specific moves (idio_z −5.3 and −4.5).Bloomberg With Market explaining little of pre-open variance and style factors carrying it, these names are trading on their own news ahead of the bell.
The instruments that embody the split: software books (IGV, and IT-services names IBM and CTSH) against memory and chip exposure (MU, SNDK, TXN, DRAM, SMH). Watch how much of the chip strength survives once the beta tailwind fades — that is the test of whether the capex shift is being priced or just riding risk appetite. On the geopolitics, the Oil factor sits at z=0.20 despite Brent's jump past $87 on the reinstated Strait of Hormuz blockade and a proposed 20% cargo toll; USO is up +2.98% and XLE only +0.70%, so the risk premium is in the barrel, not the equity — energy longs are the place to check whether that gap closes.NYT
The Consumer Price Index bls.gov, released at 8:30 AM ET, showed headline inflation cooling to 3.5% year-over-year in June, undershooting the 3.8% consensus and falling sharply from May's 4.2%, with gasoline down 9.7% and core CPI flat on the month at a 2.6% annual rate.Bloomberg Treasuries rallied immediately as investors raised bets the Fed pauses; markets now turn to Fed Chair Kevin Warsh's semiannual congressional testimony on inflation for confirmation of that path.NYT
Variance decomposition: live intraday — 20260714 session, bracketed against its trailing-year range. Factor returns are trailing through last close. Total cross-sectional dispersion: 40%ile of the past year.
Variance mix — % of total, today vs 1d ago vs 1-yr avg
market 40%ile style 99%ile thematic 82%ile idiosyncratic 9%ile
Variance explained — today vs. factor's trailing-year range
Marker = the factor's share of today's total variance, placed in its own trailing-year range (box 25–75%ile, ticks 90%ile and max). Amber marker = unusually load-bearing today (≥90%ile of its own year). Factor name green = up today / red = down.
| Factor | Today | 1d | 5d | 20d | 60d |
|---|---|---|---|---|---|
| Style-Risk | |||||
| Beta | +1.54% z+1.6 | -2.54% | -3.84% | -4.15% | +2.41% |
| Residual Volatility | -0.19% z-0.4 | +0.01% | +0.10% | -1.19% | +0.60% |
| Style | |||||
| Dividend Yield | +0.30% z+1.6 | -0.10% | +0.32% | -1.32% | +0.82% |
| Profitability | +0.20% z+1.0 | -0.11% | +0.26% | -1.13% | -0.90% |
| Leverage | +0.17% z+0.9 | -0.20% | -0.26% | -1.08% | -0.56% |
| Growth | -0.21% z-0.8 | -0.12% | +0.17% | +1.88% | +2.23% |
| Value | +0.07% z+0.3 | +0.06% | +0.17% | -0.78% | +0.19% |
| Liquidity | +0.06% z+0.2 | -0.04% | +0.04% | -2.13% | +0.07% |
| Size | -0.00% z-0.0 | -0.04% | +0.56% | +0.19% | +0.96% |
| Style-Momentum | |||||
| Long-Term Momentum | +0.98% z+1.5 | -0.32% | +0.12% | -1.58% | +4.42% |
| Medium-Term Momentum | -0.41% z-1.4 | -0.20% | -1.24% | -0.45% | +3.78% |
| One-Day Momentum | -0.40% z-1.3 | +0.02% | -0.77% | +0.07% | +2.67% |
| Short-Term Momentum | +0.04% z+0.1 | +0.15% | -0.85% | -0.24% | -1.89% |
| Style-Positioning | |||||
| Short Interest | -0.26% z-1.4 | -0.10% | -0.17% | +2.02% | +2.56% |
| Hedge-Fund Ownership | +0.01% z+0.1 | -0.03% | +0.23% | +1.31% | -0.90% |
| Style-Flow | |||||
| Morning Activity | -0.05% z-0.3 | +0.13% | +0.10% | -0.53% | -1.62% |
| Short-Sale Activity | +0.03% z+0.3 | -0.02% | -0.40% | -0.31% | -3.04% |
| Thematic | |||||
| Semiconductors | +1.16% z+1.9 | -0.35% | +0.74% | -2.57% | +1.75% |
| Treasury (Duration) | +0.30% z+0.9 | +0.23% | -0.02% | -0.42% | -2.23% |
| Gold | -0.17% z-0.5 | +0.38% | -0.14% | -0.68% | -5.52% |
| Oil | +0.10% z+0.2 | +0.59% | +1.81% | -1.33% | -0.13% |
| China | +0.08% z+0.2 | +0.19% | +0.64% | -1.02% | -6.27% |
| Bitcoin / Crypto | +0.03% z+0.1 | -0.10% | -0.01% | -0.18% | -1.34% |
Data compiled by FactorPulse AI; edited and verified by Jeff Klein. For informational purposes only. Does not constitute financial advice, an investment recommendation, or an offer to buy or sell any securities. Always consult a qualified financial professional before making investment decisions.
For more on factor construction methodology, see www.factorpulse.com/glossary.