IBM pre-announced before the open: preliminary Q2 revenue of $17.2 billion and adjusted EPS of $2.93, against FactSet consensus of $17.86 billion and $3.01CNBC. The shares are down -24.42%, the steepest one-day drop since October 1987WSJ. The decomposition says this is one company's warning being read as an industry's map: -23.41% of the move is IBM's own, the largest stock-specific move in its trailing year, with style factors contributing barely a point. What elevates it beyond Armonk is the stated mechanism — Krishna attributed the miss to clients reprioritizing capital toward supply-constrained servers, memory and storage in late June, stalling large software and consulting dealsCNBCBloomberg.
| Factor | Return | Z-Score | 5d Z | 20d Z | 63d Z | Category | Direction |
|---|---|---|---|---|---|---|---|
| Short Interest | -0.37% | z=-2.0 | z=-2.2 | z=+1.9 | z=+1.9 | Style-Positioning | Most-shorted names lagged |
| Beta | +1.39% | z=+1.4 | z=+0.2 | z=-0.7 | z=+0.7 | Style-Risk | High-beta names led |
| Value | -0.25% | z=-1.0 | z=+0.2 | z=-1.1 | z=-0.3 | Style | Cheapest names lagged |
| Profitability | -0.20% | z=-1.0 | z=+1.0 | z=-1.6 | z=-1.0 | Style | High-profit names lagged |
| Long-Term Momentum | +0.61% | z=+0.9 | z=+0.7 | z=-0.5 | z=+0.7 | Style-Momentum | 1-year winners led |
| Gold | +0.24% | z=+0.7 | z=0.0 | z=-0.4 | z=-2.4 | Thematic | Gold-linked names led |
If enterprise budgets are being drained into AI hardware, the beneficiaries should be bid — and they are. The Roundhill Memory ETF (DRAM) is up +4.81% after losing -12.01% over 20 days, a bounce that coverage frames as buyers stepping into memory-chip names after a roughly 20% correction, with ChangXin Memory's $4.35 billion Shanghai IPO — Asia's largest of 2026 — set for July 27Economic Times. EWY, home market of SK Hynix, is up +3.54% after a -15.54% 20-day slide. SLB and Liberty Energy announced they will sell power-generation equipment directly to data-center operators, and AIPO is up +1.91% at 3.6× the typical ETF paceBloomberg.
| ETF | Theme | Today | 1d Ago | 5d Ago | 20d Ago | 63d Ago |
|---|---|---|---|---|---|---|
| DRAM | memory chips & storage | +4.81% | -9.11% | -11.52% | -12.01% | +76.69% |
| EWY | south korea | +3.54% | -8.45% | -11.50% | -15.54% | +21.11% |
| GDX | gold | +3.35% | -2.86% | -6.82% | -5.60% | -26.18% |
| AIPO | AI power infrastructure | +1.91% | -3.14% | -5.20% | -2.07% | +9.40% |
| SMH | semiconductors | +1.90% | -4.16% | -3.09% | -3.91% | +34.05% |
| USO | oil | +1.68% | +8.36% | +12.88% | -8.57% | -5.63% |
| XLF | financials | +1.02% | +0.65% | -0.12% | +6.56% | +10.44% |
| XLE | energy | +0.01% | +3.01% | +6.79% | -0.67% | -0.35% |
| XLV | healthcare | -1.97% | +0.35% | -0.34% | +4.75% | +9.57% |
One caution before extrapolating the memory-chip bid: Micron is up +3.64%, but the split classifies the move as factor-driven — the beta complex contributed +4.72% while the stock's own component was slightly negative. The genuinely idiosyncratic pricing of the AI-hardware shift is happening on IBM's side of the ledger today; the winners are, so far, riding the day's risk bid rather than being marked up on their own.
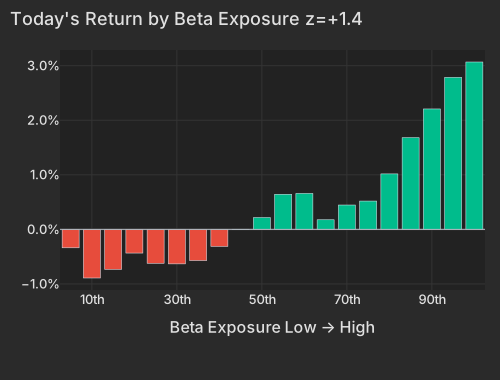
The 8:30 print did the macro work: June CPI rose 3.5% year over year against a 3.8% consensus, with core at 2.6% and flat month over month, cutting July Fed-hike odds sharplyBloomberg. The front end rallied — the two-year Treasury yield fell 7bps to 4.19% and the ten-year 4bps to 4.57%CNBC — and the dollar index dropped -0.52% to 100.71CNBC. The equity translation is the Beta factor at +1.39% (z=+1.4), the day's largest style move, with the highest-beta twentieth of the universe up +3.1%. The names doing the lifting are the usual pre-known high-beta set — Sterling Infrastructure (STRL) +6.75%, MaxLinear (MXL) +3.57%, Vicor (VICR) +2.60% — carried by the factor with little company-specific content. The softer dollar also reached the metals complex: GDX +3.35% and SLV +2.59%, though the Gold factor's 63-day z=-2.4 marks today as one good session inside a deep three-month slide (GDX -26.18% over 63 days). VXX is off -1.57%.
| Bucket | Avg Ret Pct |
|---|---|
| 1 | -0.34 |
| 2 | -0.89 |
| 3 | -0.73 |
| 4 | -0.43 |
| 5 | -0.62 |
| 6 | -0.63 |
| 7 | -0.57 |
| 8 | -0.31 |
| 9 | 0.00 |
| 10 | 0.22 |
| 11 | 0.64 |
| 12 | 0.66 |
| 13 | 0.18 |
| 14 | 0.45 |
| 15 | 0.52 |
| 16 | 1.02 |
| 17 | 1.68 |
| 18 | 2.21 |
| 19 | 2.79 |
| 20 | 3.07 |
The catch in the CPI relief is where it came from: gasoline fell 9.7% in June during a US-Iran ceasefire that has since collapsedBloomberg. WTI is back above $80 after three days of US strikes on Iran, tanker attacks, and President Trump's proposed 20% toll on Strait of Hormuz cargoBloombergNYT. USO is up +1.68% today on top of +12.88% over five sessions, while energy equities pause (XLE +0.01% after +6.79% over five days). July's inflation arithmetic will not look like June's, which caps how much a PM should pay for today's dovish tone.
All of this lands on a session where the index tells you almost nothing: the market factor explains 3.3% of cross-sectional variance versus a 9.9% one-year average, with the idiosyncratic share near 69% — names trading on their own stories, not the S&P (SPY +0.26%). Goldman Sachs is the clearest case: +8.51%, of which +7.58% is the stock's own move — its largest in a trailing year — after record equities revenue of $7.42 billion and EPS of $20.98 versus a $14.47 consensusFT. JPMorgan gained +2.77% on a record $16.9 billion quarterly profit, the largest in US banking historyNYT, Bank of America added +2.20% on record equities trading of $3.6 billion, and Wells Fargo slipped -0.83%; XLF is up +1.02%. On the losing side of the single-name ledger, Ericsson is down -12.04%, nearly all stock-specific, after a Networks revenue miss and a warning of a sustained cyclical downturnBloomberg. CrowdStrike is the odd one out: +9.14%, almost all its own move, including +4.02% over the last hour, with no cited catalyst yet in the coverage — the market is marking the name up on its own.
Health care is the only sector materially lower, median stock -0.87% and XLV down -1.97%: Eli Lilly (LLY) -2.81%, Stryker (SYK) -6.24%, Biogen (BIIB) -8.01% and Denali (DNLI) -14.99% — DNLI with -11.48% of it in the last hour — as the Senate's patent-eligibility hearing and proposed Section 301 tariffs on medical equipment pressure devices and biotech togetherFT.
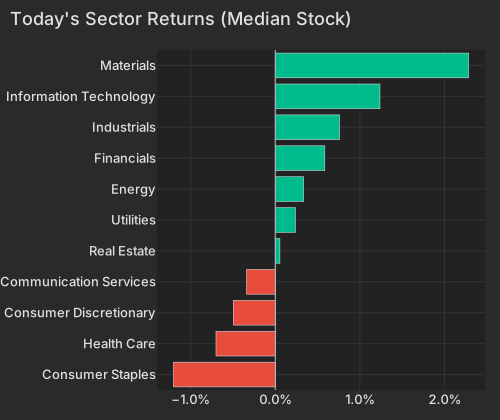
| Sector | Median Ret Pct |
|---|---|
| Consumer Staples | -1.20 |
| Health Care | -0.70 |
| Consumer Discretionary | -0.50 |
| Communication Services | -0.34 |
| Real Estate | 0.05 |
| Utilities | 0.24 |
| Energy | 0.33 |
| Financials | 0.59 |
| Industrials | 0.76 |
| Information Technology | 1.24 |
| Materials | 2.29 |
The positioning signal beneath the single-name carnage is Short Interest at z=-2.0: the most heavily shorted names underperformed the barely-shorted ones by -0.37%, the model's most durable baseline effect reasserting itself. That matters because the prior month ran the other way — the 20-day z sits at +1.9 (a +1.58% factor run), meaning heavily-shorted names had been outperforming for weeks. This week snapped back hard: 5-day z=-2.2, down four of the last five sessions, and the factor is explaining a top-decile share of cross-sectional variance relative to its own past year. Both of today's headline losers sit in that heavily-shorted cohort — IBM carries a +1.4σ short-interest exposure and Denali +2.9σ — so the pain is landing precisely where the standing short positions were already stacked. For a PM, the screen to run is long exposure to high-short-interest names that rallied over the past month; that trade is giving it back with unusual statistical force.
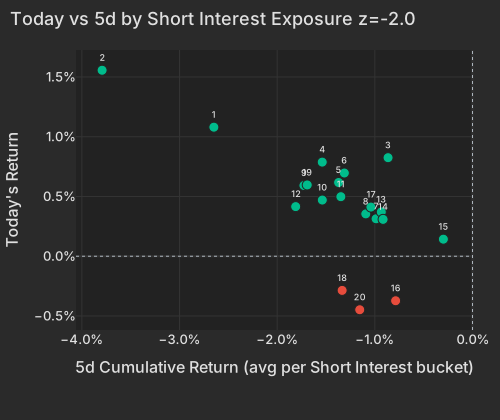
| Bucket | Ret 5D Pct | Today Ret Pct |
|---|---|---|
| 1 | -2.65 | 1.08 |
| 2 | -3.79 | 1.56 |
| 3 | -0.86 | 0.82 |
| 4 | -1.54 | 0.79 |
| 5 | -1.37 | 0.62 |
| 6 | -1.31 | 0.70 |
| 7 | -0.99 | 0.31 |
| 8 | -1.09 | 0.35 |
| 9 | -1.73 | 0.59 |
| 10 | -1.54 | 0.47 |
| 11 | -1.35 | 0.50 |
| 12 | -1.81 | 0.42 |
| 13 | -0.93 | 0.37 |
| 14 | -0.92 | 0.31 |
| 15 | -0.30 | 0.14 |
| 16 | -0.79 | -0.37 |
| 17 | -1.04 | 0.41 |
| 18 | -1.33 | -0.29 |
| 19 | -1.69 | 0.60 |
| 20 | -1.15 | -0.45 |
The Consumer Price Index bls.gov, released at 8:30 AM ET, showed headline inflation of 3.5% year over year in June against a 3.8% consensus — the largest monthly deceleration since 2020, driven by a 9.7% drop in gasoline — with core flat month over month at a 2.6% annual rate; Treasuries rallied and July hike odds fell to roughly 20%Bloomberg.
Fed Chair Kevin Warsh's semiannual testimony, which began at 10:00 AM ET, struck a harder line than the print — pledging "no tolerance" for high inflation and citing AI-driven productivity gains — leaving the rates market to net a soft print against hawkish wordsBloomberg.
Variance decomposition: live intraday — 20260714 session, bracketed against its trailing-year range. Factor returns are trailing through last close. Total cross-sectional dispersion: 42%ile of the past year.
Variance mix — % of total, today vs 1d ago vs 1-yr avg
market 46%ile style 82%ile thematic 52%ile idiosyncratic 34%ile
Variance explained — today vs. factor's trailing-year range
Marker = the factor's share of today's total variance, placed in its own trailing-year range (box 25–75%ile, ticks 90%ile and max). Amber marker = unusually load-bearing today (≥90%ile of its own year). Factor name green = up today / red = down.
| Factor | Today | 1d | 5d | 20d | 60d |
|---|---|---|---|---|---|
| Style-Risk | |||||
| Beta | +1.39% z+1.4 | -2.54% | -3.84% | -4.15% | +2.41% |
| Residual Volatility | -0.27% z-0.5 | +0.01% | +0.10% | -1.19% | +0.60% |
| Style | |||||
| Profitability | -0.20% z-1.0 | -0.11% | +0.26% | -1.13% | -0.90% |
| Value | -0.25% z-1.0 | +0.06% | +0.17% | -0.78% | +0.19% |
| Dividend Yield | +0.18% z+1.0 | -0.10% | +0.32% | -1.32% | +0.82% |
| Growth | +0.14% z+0.6 | -0.12% | +0.17% | +1.88% | +2.23% |
| Liquidity | -0.12% z-0.4 | -0.04% | +0.04% | -2.13% | +0.07% |
| Leverage | -0.06% z-0.3 | -0.20% | -0.26% | -1.08% | -0.56% |
| Size | +0.01% z+0.0 | -0.04% | +0.56% | +0.19% | +0.96% |
| Style-Momentum | |||||
| Long-Term Momentum | +0.61% z+0.9 | -0.32% | +0.12% | -1.58% | +4.42% |
| Medium-Term Momentum | -0.10% z-0.3 | -0.20% | -1.24% | -0.45% | +3.78% |
| One-Day Momentum | -0.10% z-0.3 | +0.02% | -0.77% | +0.07% | +2.67% |
| Short-Term Momentum | -0.01% z-0.0 | +0.15% | -0.85% | -0.24% | -1.89% |
| Style-Positioning | |||||
| Short Interest | -0.37% z-2.0 | -0.10% | -0.17% | +2.02% | +2.56% |
| Hedge-Fund Ownership | -0.05% z-0.4 | -0.03% | +0.23% | +1.31% | -0.90% |
| Style-Flow | |||||
| Short-Sale Activity | -0.12% z-0.9 | -0.02% | -0.40% | -0.31% | -3.04% |
| Morning Activity | -0.14% z-0.9 | +0.13% | +0.10% | -0.53% | -1.62% |
| Thematic | |||||
| Semiconductors | +0.49% z+0.8 | -0.35% | +0.74% | -2.57% | +1.75% |
| Gold | +0.24% z+0.7 | +0.38% | -0.14% | -0.68% | -5.52% |
| Bitcoin / Crypto | +0.14% z+0.5 | -0.10% | -0.01% | -0.18% | -1.34% |
| Oil | +0.17% z+0.3 | +0.59% | +1.81% | -1.33% | -0.13% |
| Treasury (Duration) | +0.03% z+0.1 | +0.23% | -0.02% | -0.42% | -2.23% |
| China | +0.01% z+0.0 | +0.19% | +0.64% | -1.02% | -6.27% |
Data compiled by FactorPulse AI; edited and verified by Jeff Klein. For informational purposes only. Does not constitute financial advice, an investment recommendation, or an offer to buy or sell any securities. Always consult a qualified financial professional before making investment decisions.
For more on factor construction methodology, see www.factorpulse.com/glossary.