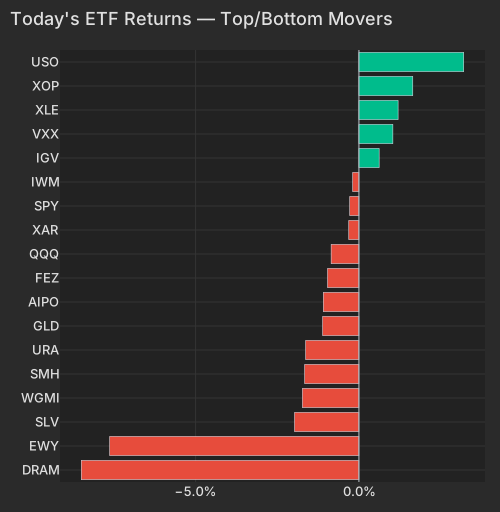
SK Hynix recorded its largest single-day plunge on record following the US trading debut, deepening a Korea selloff that has already seen $46 billion of structural capital exit emerging-market equity fundsBloomberg. A brokerage report flagging HBM4 shipments failing to scale to consensus added a fundamental excuse to what is mechanically profit-takingBloomberg. The US casualties: MU -4.43% (a $48 billion market-cap hit), SNDK -5.16%, WDC -4.93%, with SMH -1.82% and XLK -1.21% behind them. The residualized Semiconductors factor is down a comparatively modest -0.38% (z=-0.63) — the clean semis signal is far smaller than the headline carnage, which tells you where the damage actually lives (next section).
| Factor | Return | Z-Score | 5d Z | 20d Z | 63d Z | Category | Direction |
|---|---|---|---|---|---|---|---|
| Beta | -0.82% | -0.84 | -0.97 | -0.56 | +0.87 | Style-Risk | High-beta names underperformed |
| Profitability | -0.15% | -0.76 | +0.50 | z=-1.3 | z=-1.0 | Style | Most-profitable names underperformed |
| Semiconductors | -0.38% | -0.63 | +0.54 | -0.97 | -0.12 | Thematic | Semis-exposed names underperformed |
| Short-Sale Activity | +0.07% | +0.57 | z=-1.1 | -0.38 | z=-3.1 | Style-Flow | Yesterday's most heavily short-sold names outperformed |
| Gold | +0.12% | +0.35 | -0.56 | -0.64 | z=-2.8 | Thematic | Gold-exposed names outperformed |
| ETF | Theme | Today | 1d Ago | 5d Ago | 20d Ago | 63d Ago |
|---|---|---|---|---|---|---|
| DRAM | memory chips & storage | -8.58% | -2.05% | +3.97% | +9.88% | +94.69% |
| EWY | south korea | -7.81% | -0.67% | +1.88% | +2.84% | +31.75% |
| SMH | semiconductors | -1.82% | +0.54% | +3.16% | +7.03% | +42.00% |
| MTUM | momentum | -1.40% | +0.18% | +1.66% | +5.53% | +22.62% |
| XLK | technology | -1.21% | +0.23% | +2.87% | +5.18% | +30.77% |
| GLD | gold | -1.17% | -0.31% | -0.30% | +0.65% | -13.91% |
| XLE | energy | +1.23% | +0.47% | +3.49% | -5.44% | -3.92% |
| USO | oil | +3.15% | -0.28% | +4.54% | -19.06% | -14.38% |
| Sym | Theme | Ret Today Pct | Vol Pace |
|---|---|---|---|
| DRAM | technology | -8.50 | 0.80 |
| EWY | international | -7.63 | 0.74 |
| SLV | currency | -1.97 | 0.29 |
| WGMI | retail + currency | -1.73 | 0.03 |
| SMH | technology | -1.66 | 0.06 |
| URA | energy + cyclical | -1.63 | 0.06 |
| GLD | currency | -1.11 | 0.21 |
| AIPO | technology + cyclical | -1.09 | 0.08 |
| FEZ | international | -0.96 | 0.12 |
| QQQ | growth | -0.85 | 0.19 |
| XAR | cyclical | -0.31 | 0.13 |
| SPY | size | -0.28 | 0.05 |
| IWM | size | -0.19 | 0.05 |
| IGV | cyclical | 0.62 | 0.04 |
| VXX | uncertainty | 1.04 | 0.09 |
| XLE | cyclical | 1.20 | 0.05 |
| XOP | energy + cyclical | 1.65 | 0.03 |
| USO | energy + cyclical | 3.21 | 0.55 |
Here is what the wires cannot tell you: the US memory selloff is almost entirely factor carry. MU's -4.43% decomposes into -3.53% style and just -0.31% stock-specific; WDC and SNDK show the same shape, with Beta the top carrying factor in each. The same beta complex is dragging names with no memory story at all — Vicor (VICR) -3.03% and Teradyne (TER) -2.66%, both with slightly positive stock-specific moves. Because factor exposures are fixed on lagged data before the open, today's move is the market marking down a pre-known cohort — the high-beta, high-momentum names that led the 63-day run — rather than reassessing memory economics name by name. The variance mix confirms it: style factors are explaining 55% of cross-sectional variance against a 19% one-year average, and Beta's share of variance is above its one-year maximum — unusual even by pre-open standards, where a few idiosyncratic movers normally dominate. MTUM -1.40% against a +22.62% 63-day run is the same signal in ETF form.
The honest dissent: this is a one-day dent in an intact uptrend, not yet a broken regime. DRAM is still +3.97% over five days and SMH +42.00% over 63; Beta's 63-day z is a positive +0.87, so today reads as a sharp counter-trend unwind, not continuation of a downtrend. And the fundamental case has not gone away — The Economic Times reported SK Hynix itself warned of a historic global memory shortage by 2027 as AI demand outruns capacity. Watch whether the beta unwind broadens after the cash open or stays quarantined in the memory complex.
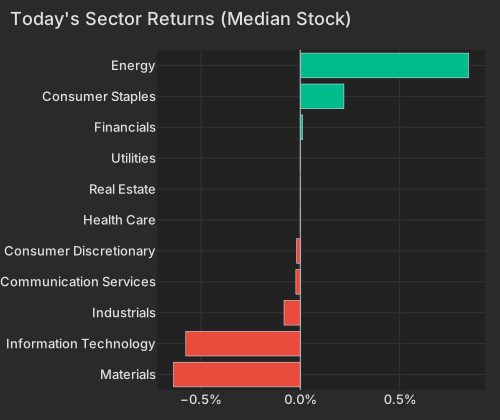
The session's second catalyst: US Central Command struck dozens of Iranian targets in response to attacks on Gulf allies — one of the heaviest bombardments since June's interim dealBloomberg. Energy is the hedge that is working: USO +3.15%, XOP +1.65%, XLE +1.23%, with Exxon (XOM) +1.28% and TotalEnergies (TTE) +1.48% making Energy the only sector meaningfully green at +0.84%Bloomberg. Note the context: this premium is being paid against a deep oil downtrend — USO is still -19.06% over 20 days — so it is a fresh geopolitical repricing, not trend momentum.
| Sector | Median Ret Pct |
|---|---|
| Materials | -0.64 |
| Information Technology | -0.58 |
| Industrials | -0.08 |
| Communication Services | -0.02 |
| Consumer Discretionary | -0.02 |
| Health Care | 0.00 |
| Real Estate | 0.00 |
| Utilities | 0.00 |
| Financials | 0.01 |
| Consumer Staples | 0.22 |
| Energy | 0.85 |
The perverse twist is in bullion: escalation is selling gold, not buying it, because the energy spike raises the odds of higher-for-longer policyBloomberg. GLD -1.17% and GDX -1.33% extend a 63-day gold-complex slide of -13.91% and -23.20% respectively — the Gold factor's 63-day z=-2.8 marks this as an established structural downtrend that today continues at the commodity level, even as the residualized factor ticked up a negligible +0.12%. Rates carry the same message: the ten-year Treasury at 4.58% (+1 bp) and the two-year at 4.23% (+1.7 bps) ahead of tomorrow's June CPI printCNBC, with the dollar index at 100.93, within a point of its late-June one-year high of 101.8CNBC.
Three genuinely stock-specific moves are worth a book check. Sotera Health (SHC) -9.21% is the largest idiosyncratic move in its trailing year — essentially all the stock's own move — on index-removal selling and its persistent litigation overhangBloomberg. Sun Life (SLF) -3.25% on an Evercore ISI downgrade after its 30% year-to-date runBloomberg. Separately, the Big Five banks — JPMorgan, Bank of America, Citigroup, Wells Fargo, Goldman Sachs — all report before tomorrow's open, with combined investment-banking fees projected at $11.1 billionEconomic Times; C +0.83%, WFC +0.56% and GS +0.42% are catching a pre-print bid, with XLF +0.27% one of the few sector funds in the green. Fastenal (FAST), which reported before the open, is quiet at +0.33%.
Where to look in the book: memory and storage beta (MU, WDC, SNDK, DRAM, SMH), Korea exposure via EWY, the momentum complex (MTUM), and the energy hedge (XLE, XOP, USO) against gold-complex longs (GLD, GDX). The trade that mattered for three months — long the high-beta AI-memory cohort — just had its first genuine stress test, and the factor tape says the unwind is being executed through the beta and momentum books, not through the names' own stories.
Variance decomposition: live intraday — 20260713 session, bracketed against its trailing-year range. Factor returns are trailing through last close. Total cross-sectional dispersion: 1%ile of the past year.
Variance mix — % of total, today vs 1d ago vs 1-yr avg
market 35%ile style 100%ile thematic 22%ile idiosyncratic 5%ile
Variance explained — today vs. factor's trailing-year range
Marker = the factor's share of today's total variance, placed in its own trailing-year range (box 25–75%ile, ticks 90%ile and max). Amber marker = unusually load-bearing today (≥90%ile of its own year). Factor name green = up today / red = down.
| Factor | Today | 1d | 5d | 20d | 60d |
|---|---|---|---|---|---|
| Style-Risk | |||||
| Beta | -0.82% z-0.8 | -0.38% | -0.21% | +1.52% | +5.28% |
| Residual Volatility | -0.08% z-0.1 | -0.49% | -0.01% | -1.52% | +1.59% |
| Style | |||||
| Profitability | -0.15% z-0.8 | +0.52% | +0.15% | -0.69% | -1.15% |
| Dividend Yield | -0.10% z-0.5 | +0.19% | +0.32% | -1.14% | +0.96% |
| Value | -0.08% z-0.3 | +0.29% | -0.19% | -0.96% | -0.30% |
| Liquidity | -0.07% z-0.2 | -0.08% | -0.06% | -2.31% | +0.99% |
| Leverage | -0.04% z-0.2 | +0.03% | -0.26% | -0.92% | -0.65% |
| Size | -0.07% z-0.2 | +0.25% | +0.92% | +0.04% | +1.02% |
| Growth | -0.01% z-0.0 | -0.12% | +0.40% | +1.65% | +2.64% |
| Style-Momentum | |||||
| Long-Term Momentum | -0.33% z-0.5 | -0.53% | +0.42% | -0.18% | +3.70% |
| One-Day Momentum | -0.10% z-0.3 | -0.14% | -1.17% | -0.24% | +3.03% |
| Medium-Term Momentum | -0.04% z-0.1 | -0.21% | -1.41% | -0.03% | +3.80% |
| Short-Term Momentum | +0.02% z+0.1 | -0.11% | -1.06% | -0.07% | -2.73% |
| Style-Positioning | |||||
| Hedge-Fund Ownership | +0.03% z+0.3 | -0.02% | +0.21% | +1.07% | -0.66% |
| Short Interest | -0.03% z-0.1 | -0.13% | -0.17% | +1.96% | +2.89% |
| Style-Flow | |||||
| Short-Sale Activity | +0.07% z+0.6 | -0.09% | -0.01% | -0.06% | -3.04% |
| Morning Activity | +0.06% z+0.4 | -0.05% | -0.03% | -0.50% | -1.82% |
| Thematic | |||||
| Semiconductors | -0.38% z-0.6 | +0.12% | +1.11% | -0.92% | +0.84% |
| Gold | +0.12% z+0.3 | -0.14% | -0.57% | -1.12% | -6.73% |
| Treasury (Duration) | +0.10% z+0.3 | +0.21% | -0.52% | -0.46% | -2.36% |
| Bitcoin / Crypto | -0.06% z-0.2 | -0.32% | +0.19% | -0.17% | -0.15% |
| China | +0.08% z+0.2 | +0.21% | +0.44% | -1.57% | -6.20% |
| Oil | +0.09% z+0.2 | -0.22% | +1.54% | -2.63% | -0.03% |
Data compiled by FactorPulse AI; edited and verified by Jeff Klein. For informational purposes only. Does not constitute financial advice, an investment recommendation, or an offer to buy or sell any securities. Always consult a qualified financial professional before making investment decisions.
For more on factor construction methodology, see www.factorpulse.com/glossary.