The catalyst is unambiguous. Washington and Tehran traded fresh strikes over the weekend and are now issuing contradictory statements about whether the Strait of Hormuz is open; commercial transits through the chokepoint have fallen to their lowest volume in 30 daysNYT. Crude repriced immediately — USO +4.06%, XOP +2.94%, XLE +2.14% at 2.1× typical pace — and energy is the day's best sector with the median stock up +1.46%, led by XOM +2.63% and CVX +2.04%Bloomberg. Note the trend context: USO is still down -19.06% over 20 days, so today is a war-premium snapback inside a falling oil tape, not a supply-driven bull trend.
The macro read is inflationary, not risk-off in the classic sense. Gold fell -2.01% (GLD) and silver -2.65% (SLV) as the energy spike raised the odds of higher-for-longer policy rather than bidding safe havensBloomberg. The ten-year Treasury yield sits at 4.60%, up 3.2 bps, with the two-year at 4.25%, up 4.0 bpsCNBC, and the dollar index is firmer at 101.10, +0.15%CNBC. Rising oil, rising yields, falling gold: the market is pricing an inflation pulse, and long-duration risk assets are paying for it.
| Factor | Return | Z-Score | 5d Z | 20d Z | 63d Z | Category | Direction |
|---|---|---|---|---|---|---|---|
| Beta | -1.91% | z=-1.9 | -1.5 | -0.8 | +0.7 | Style-Risk | Highest-beta names underperformed sharply |
| Bitcoin / Crypto | -0.31% | z=-1.0 | -0.3 | -0.3 | +0.3 | Thematic | Crypto-exposed names lagged |
| Treasury (Duration) | +0.35% | z=+1.0 | +0.1 | -0.2 | -0.7 | Thematic | Duration-exposed names outperformed |
| Value | +0.23% | z=+0.9 | +0.6 | -0.6 | -0.2 | Style | Cheapest names outperformed — contrarian to the multi-year regime |
| Long-Term Momentum | -0.57% | z=-0.9 | -0.1 | -0.6 | +0.5 | Style-Momentum | 1-year winners lagged 1-year laggards |
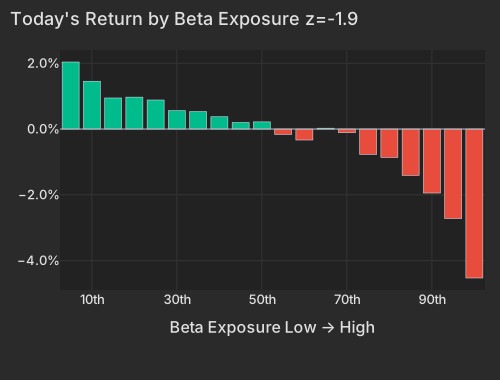
Beta is the whole story on the factor tape: -1.91% at z=-1.9, with 61% conditional importance, and the move is entirely a punishment of the top of the exposure range — the highest-beta twentieth of the universe fell -4.5% as a group, names like WOLF, POET, and AEHR, while low-beta names barely moved. Critically, today is a reversal, not a continuation: Beta's 63-day return is +5.70% (z_63d +0.7), so the cohort getting hit is precisely the one that has been paying for three months. That is the definition of a crowded-trade unwind.
| Bucket | Avg Ret Pct |
|---|---|
| 1 | 2.04 |
| 2 | 1.45 |
| 3 | 0.94 |
| 4 | 0.97 |
| 5 | 0.88 |
| 6 | 0.56 |
| 7 | 0.53 |
| 8 | 0.37 |
| 9 | 0.20 |
| 10 | 0.22 |
| 11 | -0.16 |
| 12 | -0.33 |
| 13 | 0.03 |
| 14 | -0.11 |
| 15 | -0.77 |
| 16 | -0.86 |
| 17 | -1.41 |
| 18 | -1.95 |
| 19 | -2.72 |
| 20 | -4.53 |
How unusual is this? The regime data says: very. Style factors are explaining 56% of cross-sectional variance today against a one-year average of 19%, and Beta alone accounts for 49.9% — above its maximum share on any day in the trailing year. Meanwhile the Market component explains under 1% of variance versus a 9.9% average: dispersion is extremely high, stocks are trading on their factor loadings rather than with the index, and SPY's -0.28% headline conceals it. Bloomberg can tell a PM that chips fell on Iran tensionsBloomberg; what the wires cannot show is that a single style factor is sorting the entire cross-section more forcefully than at any point in a year — a signature of concentrated positioning coming out all at once, not of a macro-wide de-risking.
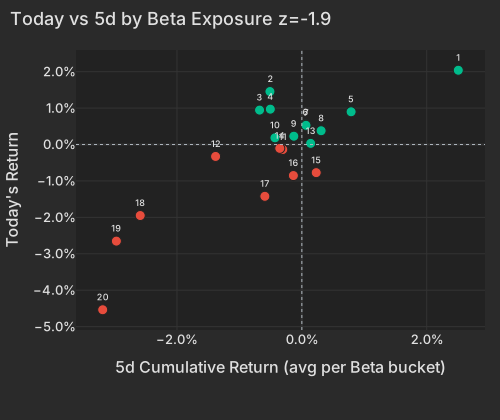
| Bucket | Ret 5D Pct | Today Ret Pct |
|---|---|---|
| 1 | 2.51 | 2.04 |
| 2 | -0.51 | 1.45 |
| 3 | -0.68 | 0.94 |
| 4 | -0.50 | 0.97 |
| 5 | 0.79 | 0.90 |
| 6 | 0.06 | 0.54 |
| 7 | 0.07 | 0.53 |
| 8 | 0.31 | 0.38 |
| 9 | -0.13 | 0.23 |
| 10 | -0.43 | 0.18 |
| 11 | -0.31 | -0.14 |
| 12 | -1.38 | -0.33 |
| 13 | 0.14 | 0.03 |
| 14 | -0.35 | -0.11 |
| 15 | 0.23 | -0.77 |
| 16 | -0.14 | -0.85 |
| 17 | -0.59 | -1.42 |
| 18 | -2.59 | -1.95 |
| 19 | -2.97 | -2.65 |
| 20 | -3.19 | -4.54 |
The pressure is also fresh, not stale tape: ARM has lost -4.82% in the last hour of its -8.12% decline, and ORCL -2.64% of its -3.32% — the unwind is accelerating into mid-morning, not fading.
The epicenter is the memory-chip and Korea complex. SK Hynix posted its largest-ever single-day plunge in Seoul, dragging its newly listed US ADRs into a second straight day of selling, even as its CEO warned of a record global memory shortage by 2027BloombergBloomberg. The tradable fallout: DRAM -7.81% and EWY -6.75%, both at 2.1× typical ETF pace, against SMH's comparatively mild -2.27% — the selling is memory-specific within semis, not sector-wide.
| ETF | Theme | Today | 1d Ago | 5d Ago | 20d Ago | 63d Ago |
|---|---|---|---|---|---|---|
| DRAM (2.1× vol) | memory chips & storage | -7.81% | -2.05% | +3.97% | +9.88% | +94.69% |
| EWY (2.1× vol) | south korea | -6.75% | -0.67% | +1.88% | +2.84% | +31.75% |
| SMH | semiconductors | -2.27% | +0.54% | +3.16% | +7.03% | +42.00% |
| DTCR | data centers | -1.96% | +0.45% | +2.74% | -2.60% | +12.33% |
| GLD | gold | -2.01% | -0.31% | -0.30% | +0.65% | -13.91% |
| USO (3.0× vol) | oil | +4.06% | -0.28% | +4.54% | -19.06% | -14.38% |
| XLE (2.1× vol) | energy | +2.14% | +0.47% | +3.49% | -5.44% | -3.92% |
| XLP | consumer staples | +1.03% | +1.11% | -1.02% | -1.60% | +0.80% |
| VNQ (2.2× vol) | real estate | +0.72% | +0.24% | -0.71% | -0.37% | +4.89% |
Here is the read the headlines miss: the biggest memory casualties are not being repriced on their own fundamentals. Micron (MU) is down -5.65%, but the decomposition attributes essentially all of it to factor carry — its own stock-specific component is actually positive. Same picture at MaxLinear (MXL) -5.74%, Aehr (AEHR) -4.31%, and Astera Labs (ALAB) -8.30%: the beta complex is doing the heavy lifting, with almost nothing company-specific. Sandisk (SNDK), down -9.39%, is roughly three-quarters factor carry. And the fundamentals argument for the complex has not deteriorated — TSMC reported a 68% surge in June revenue this morningBloomberg, and DRAM is still up +3.97% over five days. The honest counterargument to the "just positioning" read is Korea itself: emerging-market equity funds saw a $46 billion June exodus led by Korea and Taiwan de-riskingBloomberg, so the marginal seller may be structural, not tactical — that is the scenario in which today's unwind extends rather than snaps back.
The other side of the unwind is orderly, not panicked: Consumer Staples +1.06% and Real Estate +0.91% on a median-stock basis, VNQ +0.72% at 2.2× typical pace, and the Value factor +0.23% (z=+0.9) as the cheapest names outperformed the most expensive — a contrarian session against the multi-year run in which cheap names have persistently lagged, corroborated by IWD +0.42% against IWF -0.94%. VXX is up just +1.46% after a -20.56% 20-day slide — the volatility complex is not confirming a broad risk event.
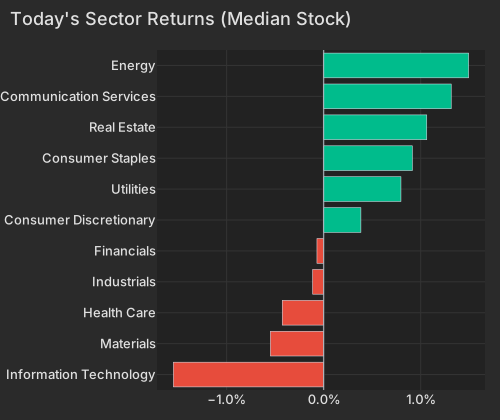
| Sector | Median Ret Pct |
|---|---|
| Information Technology | -1.55 |
| Materials | -0.55 |
| Health Care | -0.43 |
| Industrials | -0.11 |
| Financials | -0.07 |
| Consumer Discretionary | 0.38 |
| Utilities | 0.80 |
| Consumer Staples | 0.91 |
| Real Estate | 1.06 |
| Communication Services | 1.31 |
| Energy | 1.49 |
Beneath the factor tape, a heavy idiosyncratic ledger: TransDigm (TDG) fell -4.51% — almost entirely its own move, the sharpest stock-specific decline in its trailing year — after terminating its $960 million acquisition of Stellant Systems on regulatory delaysEconomic Times. AppLovin (APP) dropped -8.87%, with -8.08% of it in the last hour, on a BofA report flagging a muted start to its eCommerce expansionEconomic Times — a genuine stock story, not beta carry. On the winning side, Verra Mobility (VRRM) is up +9.85% on a JPMorgan upgradeEconomic Times and Freshpet (FRPT) +8.67%, both nearly all stock-specific. First Hawaiian (FHB) fell -4.56% — the single largest idiosyncratic decline in the universe today, tied on the tape to an announced all-stock TriCo Bancshares acquisition that has not yet hit tier-1 coverage.
Two forward markers for the book: Fastenal (FAST), which reported before the open, is up +2.02% — a quiet industrial beat on a day industrials were flat. And tomorrow morning brings JPMorgan, Goldman Sachs, Citigroup, and Wells Fargo, with the five biggest banks forecast to post $11.1 billion in Q2 investment-banking fees, the largest haul in four yearsFT — Iran-driven trading volatility is, perversely, part of that revenue story. Where to look in the book: high-beta AI and memory exposure (DRAM, EWY, SMH, MU, SNDK, ARM, ALAB) for unwind risk, XLE/XOP/USO for the war-premium hedge, and XLP/VNQ/IWD as the rotation's destination.
Variance decomposition: live intraday — 20260713 session, bracketed against its trailing-year range. Factor returns are trailing through last close. Total cross-sectional dispersion: 14%ile of the past year.
Variance mix — % of total, today vs 1d ago vs 1-yr avg
market 24%ile style 100%ile thematic 50%ile idiosyncratic 4%ile
Variance explained — today vs. factor's trailing-year range
Marker = the factor's share of today's total variance, placed in its own trailing-year range (box 25–75%ile, ticks 90%ile and max). Amber marker = unusually load-bearing today (≥90%ile of its own year). Factor name green = up today / red = down.
| Factor | Today | 1d | 5d | 20d | 60d |
|---|---|---|---|---|---|
| Style-Risk | |||||
| Beta | -1.91% z-1.9 | -0.38% | -0.21% | +1.52% | +5.28% |
| Residual Volatility | -0.26% z-0.5 | -0.49% | -0.01% | -1.52% | +1.59% |
| Style | |||||
| Value | +0.23% z+0.9 | +0.29% | -0.19% | -0.96% | -0.30% |
| Dividend Yield | -0.09% z-0.5 | +0.19% | +0.32% | -1.14% | +0.96% |
| Growth | -0.10% z-0.4 | -0.12% | +0.40% | +1.65% | +2.64% |
| Leverage | +0.07% z+0.4 | +0.03% | -0.26% | -0.92% | -0.65% |
| Profitability | +0.07% z+0.3 | +0.52% | +0.15% | -0.69% | -1.15% |
| Size | -0.11% z-0.3 | +0.25% | +0.92% | +0.04% | +1.02% |
| Liquidity | -0.07% z-0.2 | -0.08% | -0.06% | -2.31% | +0.99% |
| Style-Momentum | |||||
| Long-Term Momentum | -0.57% z-0.9 | -0.53% | +0.42% | -0.18% | +3.70% |
| One-Day Momentum | +0.17% z+0.6 | -0.14% | -1.17% | -0.24% | +3.03% |
| Medium-Term Momentum | -0.11% z-0.4 | -0.21% | -1.41% | -0.03% | +3.80% |
| Short-Term Momentum | +0.00% z+0.0 | -0.11% | -1.06% | -0.07% | -2.73% |
| Style-Positioning | |||||
| Short Interest | -0.03% z-0.1 | -0.13% | -0.17% | +1.96% | +2.89% |
| Hedge-Fund Ownership | -0.01% z-0.1 | -0.02% | +0.21% | +1.07% | -0.66% |
| Style-Flow | |||||
| Morning Activity | -0.01% z-0.1 | -0.05% | -0.03% | -0.50% | -1.82% |
| Short-Sale Activity | +0.00% z+0.0 | -0.09% | -0.01% | -0.06% | -3.04% |
| Thematic | |||||
| Bitcoin / Crypto | -0.31% z-1.0 | -0.32% | +0.19% | -0.17% | -0.15% |
| Treasury (Duration) | +0.35% z+1.0 | +0.21% | -0.52% | -0.46% | -2.36% |
| Semiconductors | -0.45% z-0.8 | +0.12% | +1.11% | -0.92% | +0.84% |
| China | +0.25% z+0.6 | +0.21% | +0.44% | -1.57% | -6.20% |
| Gold | +0.13% z+0.4 | -0.14% | -0.57% | -1.12% | -6.73% |
| Oil | +0.15% z+0.3 | -0.22% | +1.54% | -2.63% | -0.03% |
Data compiled by FactorPulse AI; edited and verified by Jeff Klein. For informational purposes only. Does not constitute financial advice, an investment recommendation, or an offer to buy or sell any securities. Always consult a qualified financial professional before making investment decisions.
For more on factor construction methodology, see www.factorpulse.com/glossary.