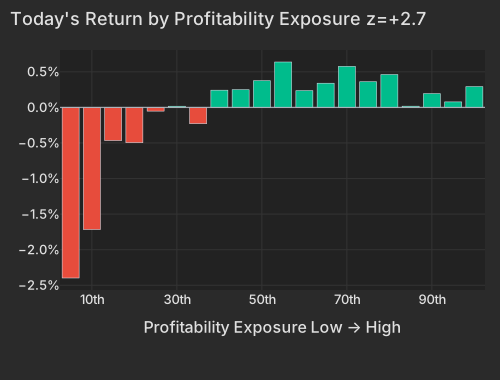
The Profitability print is a reversal, not a continuation. The factor came into today down -0.68% over 20 days and -1.34% over 63 (z_20d -0.78, z_63d -0.87) — a months-long stretch in which unprofitable names outran quality. Today that cohort got hit, and the hit was one-sided: the cross-sectional profile is left-tail driven, with bucket 1 (least profitable) down -2.4% while the profitable end of the book simply held. The rest of the quality complex confirmed: Residual Volatility -0.56% (z=-1.1, the most volatile names lagging), Dividend Yield +0.22% (z=+1.2), and Value +0.33% (z=+1.3) — the cheapest names outperforming the most expensive, a contrarian one-day move against a multi-year regime in which cheap has persistently lagged, and nothing more than a day until proven otherwise.
| Bucket | Avg Ret Pct |
|---|---|
| 1 | -2.40 |
| 2 | -1.72 |
| 3 | -0.47 |
| 4 | -0.50 |
| 5 | -0.05 |
| 6 | 0.02 |
| 7 | -0.23 |
| 8 | 0.24 |
| 9 | 0.25 |
| 10 | 0.37 |
| 11 | 0.64 |
| 12 | 0.24 |
| 13 | 0.34 |
| 14 | 0.58 |
| 15 | 0.36 |
| 16 | 0.46 |
| 17 | 0.02 |
| 18 | 0.19 |
| 19 | 0.08 |
| 20 | 0.29 |
| Factor | Return | Z-Score | 5d Z | 20d Z | 63d Z | Category | Direction |
|---|---|---|---|---|---|---|---|
| Profitability | +0.53% | z=+2.7 | +0.4 | -0.8 | -0.9 | Style | Quality paid; junk flushed |
| Value | +0.33% | z=+1.3 | -0.3 | -0.8 | -0.3 | Style | Cheapest over most expensive |
| Bitcoin / Crypto | -0.36% | z=-1.2 | +0.2 | -0.2 | +0.3 | Thematic | Crypto-linked names lagged |
| Dividend Yield | +0.22% | z=+1.2 | +0.8 | -1.3 | +0.7 | Style | Payers bid |
| Residual Volatility | -0.56% | z=-1.1 | -0.1 | -0.7 | +0.6 | Style-Risk | High-vol names lagged |
The mechanism is specific: Ionis Pharmaceuticals' (IONS) Phase 3 CARDIO-TTRansform trial of eplontersen in ATTR cardiomyopathy failed its primary efficacy endpoint, sending the stock down more than 20% and knocking roughly $3 billion off its market value Trefis. That gave a crowded, parabolic sector its excuse: XBI fell -3.14% on 2× the typical ETF pace, and the profit-taking spread down the quality spectrum — Rhythm Pharmaceuticals (RYTM) fell about 6% in a sell-the-news reaction to positive published Phase 3 data, and Kura (KURA), Insmed (INSM), and Iovance (IOVA) populated the Profitability factor's hardest-hit bucket. Moderna (MRNA) was the largest casualty at -10.89%, and the factor complex did unusual work in that move: its style drag of -3.04% sits at the 96%ile of its own trailing year, exactly what a Profitability-led flush looks like from inside a heavily shorted, unprofitable-growth name.
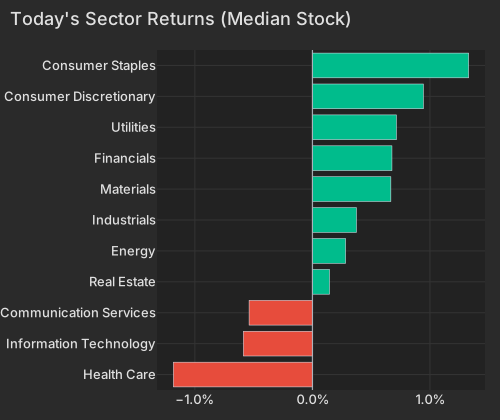
The sector spread was the widest of the session: Health Care's median stock fell -1.59% (Gilead -3.62%, AstraZeneca -3.60%, Lilly -2.18%) while Consumer Staples' median rose +1.45% — the defensive, cash-generative end of the market absorbing what biotech shed. The same junk-off pattern showed up in crypto-linked equities, with the Bitcoin/Crypto factor at z=-1.2 and WGMI (crypto miners) down -2.91%.
| Sector | Median Ret Pct |
|---|---|
| Health Care | -1.18 |
| Information Technology | -0.59 |
| Communication Services | -0.54 |
| Real Estate | 0.15 |
| Energy | 0.28 |
| Industrials | 0.37 |
| Materials | 0.67 |
| Financials | 0.68 |
| Utilities | 0.71 |
| Consumer Discretionary | 0.94 |
| Consumer Staples | 1.33 |
| ETF | Theme | Today | 1d Ago | 5d Ago | 20d Ago | 63d Ago |
|---|---|---|---|---|---|---|
| XBI | biotech growth | -3.14% | +0.80% | +4.94% | +25.04% | +25.74% |
| WGMI | crypto miners | -2.91% | +3.73% | -2.70% | -9.42% | +41.16% |
| DRAM | memory chips & storage | -1.97% | +3.74% | -2.28% | +7.52% | +98.21% |
| ARKK | innovation growth | -1.53% | +1.71% | -0.39% | +8.71% | +15.88% |
| IGV | software | -1.52% | +1.51% | +0.58% | +1.00% | +17.72% |
| SPY | large cap | +0.41% | +0.85% | +0.80% | +1.99% | +11.20% |
| QUAL | quality | +0.52% | +0.73% | -0.17% | +2.05% | +9.79% |
| XLC | communication services | +1.02% | +0.96% | +0.70% | -0.87% | -2.90% |
| XLP | consumer staples | +1.11% | -1.41% | -0.12% | -1.07% | +0.51% |
The table tells one story twice: everything down today — XBI, WGMI, DRAM, ARKK, IGV — is sitting on a large multi-week or multi-month run, and everything up is the cheap, profitable, defensive residue the market had been ignoring. The memory-chip complex fits the same template: DRAM fell -1.97% against a +98.21% 63-day run as SK Hynix's ADRs surged in their Nasdaq debut and Micron fell 2.8% on memory-exposure rotation, Barron's reported. In expensive software, CrowdStrike (CRWD) fell -5.75% — mostly its own move, but with a -1.43% style drag consistent with its position at the expensive end of the Value spectrum — against IGV's -1.52%.
The regime context makes today unusual twice over. Market explained just 0.6% of cross-sectional variance against a one-year average of 9.9% — an extreme-dispersion session in which names traded on their own stories, not the index — while the idiosyncratic share ran to 78.7%. The single-stock tape delivered accordingly: Vodafone (VOD) rose +12.81% — essentially all of it stock-specific, the largest such move in its trailing year — on reports that billionaire Xavier Niel, a 2.5% holder via Atlas Investissement, could catalyze the company's restructuring FT. Meta (META) added +5.69%, tracking its best week since early 2024 on optimism around its AI and cloud strategy, shrugging off an escalated EU probe into addictive platform design Bloomberg. And WD-40 (WDFC) — a name with heavy positive Profitability exposure — rose +10.60% after a Q3 beat, with adjusted EPS of $2.33 roughly 48% above estimates and full-year guidance raised, the single cleanest embodiment of the day's quality-gets-paid signal. Jackson Financial (JXN, +6.05%) and PriceSmart (PSMT, +5.00%) round out a list of stock-specific gainers with no factor story attached.
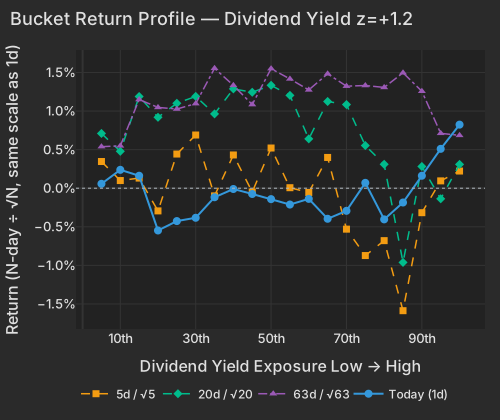
The honest counterargument: today reverses nothing yet. Profitability is still down -1.34% over 63 days, XBI is still up +25.74% over the same window even after today, and the AI-hardware trade barely blinked — SMH rose +0.59% with Nvidia +3.61% and AMD +1.52%. Dividend Yield tells the same cautionary story: today's payer bid (z=+1.2) cuts against a 20-day stretch in which the factor lost -1.12% (z_20d -1.33). Until the quality complex strings together more than a session, this reads as a positioning shakeout in the most extended corner of the market, not a regime change.
| Bucket | Ret 1D Pct | Ret 5D Norm Pct | Ret 20D Norm Pct | Ret 63D Norm Pct |
|---|---|---|---|---|
| 1 | 0.06 | 0.35 | 0.71 | 0.54 |
| 2 | 0.24 | 0.10 | 0.48 | 0.55 |
| 3 | 0.16 | 0.13 | 1.19 | 1.15 |
| 4 | -0.55 | -0.29 | 0.92 | 1.05 |
| 5 | -0.43 | 0.44 | 1.10 | 1.03 |
| 6 | -0.38 | 0.69 | 1.19 | 1.10 |
| 7 | -0.12 | -0.10 | 0.96 | 1.55 |
| 8 | -0.01 | 0.43 | 1.29 | 1.33 |
| 9 | -0.07 | -0.05 | 1.24 | 1.08 |
| 10 | -0.14 | 0.52 | 1.33 | 1.55 |
| 11 | -0.21 | 0.01 | 1.20 | 1.42 |
| 12 | -0.14 | -0.06 | 0.64 | 1.27 |
| 13 | -0.40 | 0.40 | 1.12 | 1.48 |
| 14 | -0.29 | -0.53 | 1.08 | 1.32 |
| 15 | 0.07 | -0.87 | 0.55 | 1.33 |
| 16 | -0.40 | -0.68 | 0.31 | 1.31 |
| 17 | -0.19 | -1.59 | -0.96 | 1.50 |
| 18 | 0.16 | -0.32 | 0.28 | 1.26 |
| 19 | 0.51 | 0.10 | -0.14 | 0.71 |
| 20 | 0.82 | 0.22 | 0.31 | 0.68 |
The rate backdrop leans the same defensive way. The 30-year Treasury held above the 5% line at 5.066% CNBC, with the 2-year up 4.4 bps to 4.206% against a 1.3 bp move at the long end CNBC — pressure that follows the Fed's hawkish semi-annual Monetary Policy Report ahead of Chair Kevin Warsh's July 14 testimony Economic Times. LQD fell -0.22% on 1.9× the typical ETF pace, the duration-sensitive credit complex quietly confirming what the long bond is saying.
Where to look in the book: the unprofitable-biotech axis (XBI, IBB, and single names MRNA, KURA, INSM, RYTM, IOVA), the extended-growth complex (ARKK, IGV, CRWD, DRAM), and the quality/defensive side that absorbed the rotation (QUAL, XLP, DGRO, WDFC). If Profitability posts a second consecutive positive day of this conviction, the 63-day quality drought — not today's flush — becomes the anomaly.
The New York Fed Staff Nowcast, released at 12:45 PM ET, held Q2 2026 GDP bea.gov growth unchanged at 2.7% and Q3 at 2.4%, with positive unemployment-data effects offset by softer nonfarm payroll bls.gov and ADP adpemploymentreport.com surprises; market reaction was muted as attention pivots to next week's June CPI bls.gov print and Chair Warsh's testimony.
Variance decomposition: live intraday — 20260710 session, bracketed against its trailing-year range. Factor returns are trailing through last close. Total cross-sectional dispersion: 9%ile of the past year.
Variance mix — % of total, today vs 1d ago vs 1-yr avg
market 18%ile style 66%ile thematic 24%ile idiosyncratic 61%ile
Variance explained — today vs. factor's trailing-year range
Marker = the factor's share of today's total variance, placed in its own trailing-year range (box 25–75%ile, ticks 90%ile and max). Amber marker = unusually load-bearing today (≥90%ile of its own year). Factor name green = up today / red = down.
| Factor | Today | 1d | 5d | 20d | 60d |
|---|---|---|---|---|---|
| Style-Risk | |||||
| Residual Volatility | -0.56% z-1.1 | +0.13% | +0.19% | -0.94% | +2.05% |
| Beta | -0.33% z-0.3 | +1.59% | -2.65% | +0.00% | +7.02% |
| Style | |||||
| Profitability | +0.53% z+2.7 | +0.04% | -0.68% | -1.22% | -1.79% |
| Value | +0.33% z+1.4 | +0.15% | -0.68% | -1.71% | -0.73% |
| Dividend Yield | +0.22% z+1.2 | -0.03% | -0.18% | -1.08% | +0.74% |
| Size | +0.24% z+0.6 | -0.22% | +0.63% | -0.45% | +1.00% |
| Growth | -0.16% z-0.6 | +0.10% | +0.45% | +1.82% | +3.18% |
| Liquidity | -0.15% z-0.5 | -0.20% | -0.28% | -1.94% | +1.39% |
| Leverage | +0.06% z+0.3 | -0.10% | -0.40% | -0.99% | -0.54% |
| Style-Momentum | |||||
| Long-Term Momentum | -0.56% z-0.8 | +0.20% | -0.65% | +0.82% | +3.97% |
| Medium-Term Momentum | -0.20% z-0.7 | +0.17% | -1.23% | +0.07% | +3.46% |
| One-Day Momentum | -0.14% z-0.5 | -0.27% | -0.47% | -0.07% | +3.09% |
| Short-Term Momentum | -0.15% z-0.4 | -0.06% | -1.10% | +0.25% | -2.60% |
| Style-Positioning | |||||
| Short Interest | -0.12% z-0.6 | -0.07% | +0.19% | +2.02% | +3.34% |
| Hedge-Fund Ownership | -0.04% z-0.3 | +0.04% | +0.26% | +1.12% | -0.39% |
| Style-Flow | |||||
| Short-Sale Activity | -0.04% z-0.3 | -0.22% | +0.28% | +0.14% | -2.94% |
| Morning Activity | -0.05% z-0.3 | -0.07% | +0.28% | -0.56% | -1.89% |
| Thematic | |||||
| Bitcoin / Crypto | -0.36% z-1.2 | -0.10% | +0.76% | +0.39% | +0.67% |
| Treasury (Duration) | +0.24% z+0.7 | -0.15% | -0.38% | -0.77% | -2.51% |
| Oil | -0.32% z-0.6 | -0.23% | +0.89% | -1.77% | -0.23% |
| Gold | -0.16% z-0.5 | -0.14% | +0.66% | -1.41% | -6.71% |
| China | +0.20% z+0.5 | -0.10% | +0.38% | -1.36% | -6.18% |
| Semiconductors | +0.13% z+0.2 | +0.28% | -0.60% | -1.29% | +0.59% |
Data compiled by FactorPulse AI; edited and verified by Jeff Klein. For informational purposes only. Does not constitute financial advice, an investment recommendation, or an offer to buy or sell any securities. Always consult a qualified financial professional before making investment decisions.
For more on factor construction methodology, see www.factorpulse.com/glossary.