Micron committed $250 billion of U.S. capital expenditure to scale advanced memory production for AI infrastructureBloomberg, and SK Hynix — the dominant supplier of high-bandwidth memory, the tightest bottleneck in the AI build-out — drew heavy oversubscription for its ADR pricing tonight ahead of a July 10 Nasdaq debutBloomberg. The tape priced both at once: the Roundhill Memory ETF (DRAM) gained +4.19%, MU rose +4.34%, AMD +5.62%, AVGO +3.64%, and SMH added +2.74%. South Korea (EWY, SK Hynix's home market) rose +1.01% and sits on a +43.66% 63-day run. Within the Semiconductors factor's extreme cohort, the memory-and-storage names posted a weighted +5.55% — the single hottest theme in the cross-section.
| Factor | Return | Z-Score | 5d Z | 20d Z | 63d Z | Category | Direction |
|---|---|---|---|---|---|---|---|
| Beta | +1.62% | z=+1.7 | -1.2 | 0.0 | +1.2 | Style-Risk | Highest-beta names led |
| Short-Sale Activity | -0.23% | z=-1.8 | +1.0 | +0.2 | -3.5 | Style-Flow | Yesterday's short-sale flow paid off T+1 |
| Semiconductors | +0.34% | z=+0.6 | -0.4 | -0.5 | +0.3 | Thematic | Semis-exposed outperformed |
| Size | -0.22% | z=-0.6 | +0.7 | -0.3 | +0.4 | Style | Large caps lagged |
| Short-Term Momentum | -0.10% | z=-0.3 | -1.5 | +0.1 | -1.0 | Style-Momentum | Past week's losers bounced |
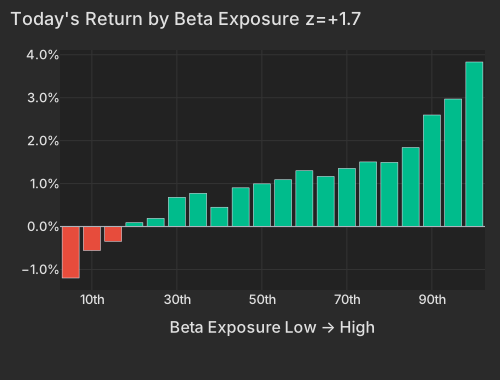
Beta returned +1.62% (z=+1.7) and the move was carried by the extreme right tail — the highest-beta bucket gained +3.8% while the rest of the exposure spectrum did comparatively little. Crucially, the names doing the lifting were factor-carried, not stock stories: MXL +11.33%, AEHR +12.26%, ACMR +8.36%, VICR +5.49%, and UCTT +5.10% all rode the beta complex with little to no company-specific contribution. That is the read the headline "AI rally" misses: the day rewarded market sensitivity, and the semis-equipment fringe happened to be where the market sensitivity lives.
| Bucket | Avg Ret Pct |
|---|---|
| 1 | -1.20 |
| 2 | -0.56 |
| 3 | -0.34 |
| 4 | 0.09 |
| 5 | 0.19 |
| 6 | 0.68 |
| 7 | 0.77 |
| 8 | 0.45 |
| 9 | 0.90 |
| 10 | 0.99 |
| 11 | 1.09 |
| 12 | 1.30 |
| 13 | 1.17 |
| 14 | 1.35 |
| 15 | 1.50 |
| 16 | 1.49 |
| 17 | 1.84 |
| 18 | 2.60 |
| 19 | 2.97 |
| 20 | 3.83 |
Context matters for how much to trust it. Beta comes into today off a -2.62% five-day drawdown (5d z=-1.2) inside a quarter where it has returned +9.36% — today is a snap-back within an intact quarterly risk-on trend, not a fresh breakout. The same shape holds at the ETF level: SMH is +2.74% today but still -9.59% over five sessions against a +48.29% 63-day run; MTUM +2.02% today versus -8.16% on the week. And the residualized Semiconductors factor has been leaning the other way for a month — high-semis-exposure names have persistently underperformed over the trailing 20 days — so today's bid cuts against a month of pressure rather than extending a clean trend.
| Bucket | Ret 1D Pct | Ret 5D Norm Pct | Ret 20D Norm Pct | Ret 63D Norm Pct |
|---|---|---|---|---|
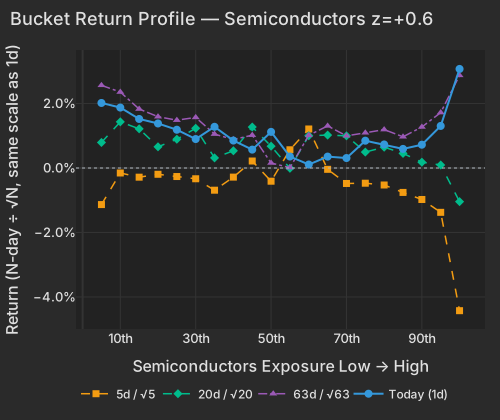
| 1 | 2.02 | -1.13 | 0.79 | 2.56 |
| 2 | 1.87 | -0.15 | 1.43 | 2.36 |
| 3 | 1.52 | -0.28 | 1.22 | 1.83 |
| 4 | 1.38 | -0.19 | 0.66 | 1.59 |
| 5 | 1.19 | -0.26 | 0.89 | 1.48 |
| 6 | 0.90 | -0.33 | 1.23 | 1.57 |
| 7 | 1.28 | -0.69 | 0.31 | 1.05 |
| 8 | 0.85 | -0.28 | 0.53 | 0.88 |
| 9 | 0.57 | 0.22 | 1.27 | 1.02 |
| 10 | 1.12 | -0.41 | 0.68 | 0.16 |
| 11 | 0.36 | 0.57 | -0.01 | 0.01 |
| 12 | 0.11 | 1.21 | 1.00 | 1.01 |
| 13 | 0.35 | -0.04 | 1.02 | 1.30 |
| 14 | 0.31 | -0.48 | 1.00 | 1.00 |
| 15 | 0.85 | -0.47 | 0.49 | 1.09 |
| 16 | 0.73 | -0.53 | 0.65 | 1.19 |
| 17 | 0.59 | -0.76 | 0.45 | 0.97 |
| 18 | 0.72 | -0.98 | 0.18 | 1.27 |
| 19 | 1.30 | -1.37 | 0.09 | 1.72 |
| 20 | 3.07 | -4.42 | -1.04 | 2.87 |
| ETF | Theme | Today | 1d Ago | 5d Ago | 20d Ago | 63d Ago |
|---|---|---|---|---|---|---|
| DRAM | memory chips & storage | +4.19% | +2.39% | -15.99% | +2.51% | +110.73% |
| SMH | semiconductors | +2.74% | +1.99% | -9.59% | -0.86% | +48.29% |
| XLK | technology | +2.29% | +1.24% | -4.79% | -1.51% | +31.99% |
| MTUM | momentum | +2.02% | +0.77% | -8.16% | -0.07% | +26.30% |
| QQQ | large cap growth | +1.70% | +0.28% | -3.39% | -0.65% | +20.87% |
| EWY | south korea | +1.01% | +0.79% | -9.50% | -1.57% | +43.66% |
| XLE | energy | -1.29% | +1.76% | +4.69% | -4.68% | -7.58% |
| XOP | oil E&P | -1.41% | +2.94% | +5.01% | -3.80% | -10.18% |
| XLP | consumer staples | -1.48% | -0.55% | +1.59% | +1.59% | +3.85% |
| USO | oil | -2.96% | +3.02% | +5.42% | -16.97% | -18.74% |
Two structural reads the wires won't carry. First, Beta explained roughly 25% of factor-attributable cross-sectional variance today — its heaviest load in over a year, against a style complex (27.8% of total variance versus a 19.0% one-year average) that is itself running hot. Books with net high-beta exposure got paid today, but that exposure is now doing an unusually large share of the work across the whole cross-section. Second, Short-Sale Activity posted z=-1.8 on a small -0.23% move, extending a 63-day z=-3.5 regime: the names most heavily short-sold yesterday underperformed the barely-shorted cohort again, meaning yesterday's short-sale flow paid off T+1 — the model's most statistically reliable effect, and it has been compounding for a quarter. Small in basis points, high in conviction, and entirely invisible in an index-level wrap.
The day's biggest moves had nothing to do with beta. Ionis (IONS) fell -23.81% — erasing $3.25B of market value — after the Phase 3 CARDIO-TTRansform trial of eplontersen (Wainua) failed its primary cardiovascular endpoint. Partner AstraZeneca (AZN) dropped -5.58%, a setback for a key piece of its 2030 revenue ambitionsFinancial Times, while BridgeBio (BBIO) — whose rival ATTR-CM therapy loses a major competitive threat — jumped +16.25%. The decomposition confirms all three are the stocks' own moves, not factor spillover — IONS's stock-specific return is the most extreme in its trailing year by a wide margin — and XBI (+0.72% today, +26.89% over 20 days) shows the broader biotech complex shrugged it off entirely.
Crude reversed as traders faded supply-disruption risk from a second consecutive day of U.S.-Iran strikesBloomberg: USO fell -2.96% and XOP -1.41%, giving back part of a +5.42% and +5.01% five-day war-premium run respectively, with XOM -2.70% and COP -2.35%. Consumer Staples was the other clear loser (XLP -1.48%): PepsiCo (PEP) fell -3.38% after its Q2 print flagged soft North American volumesBloomberg, and Costco (COST) dropped -4.19% as investors looked past strong June sales to its premium valuationEconomic Times. The exception in staples was WD-40 (WDFC), +9.58% after a 48% EPS beat and raised FY2026 guidanceMarketWatch.
| Sector | Median Ret Pct |
|---|---|
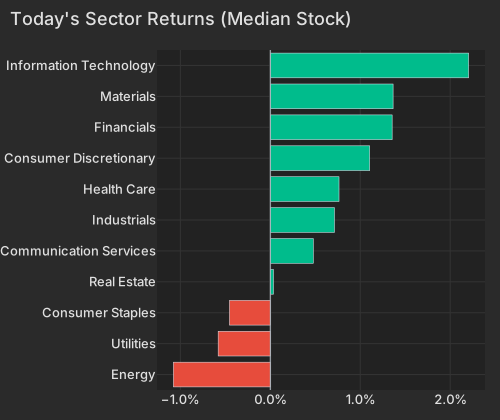
| Energy | -1.08 |
| Utilities | -0.58 |
| Consumer Staples | -0.45 |
| Real Estate | 0.03 |
| Communication Services | 0.48 |
| Industrials | 0.71 |
| Health Care | 0.76 |
| Consumer Discretionary | 1.10 |
| Financials | 1.35 |
| Materials | 1.36 |
| Information Technology | 2.20 |
Where to look in the book: DRAM, SMH, and EWY for the memory trade and tomorrow's SK Hynix debut; MXL, AEHR, ACMR, and UCTT as the high-beta semis-equipment fringe most exposed if the beta bid fades back into its 5-day downtrend; XOP and XLE for continued war-premium unwind; and Delta (DAL, +2.07% today on pre-earnings positioning) reports after tonight's close.
Initial jobless claims the BLS, released at 8:30 AM ET, fell 2,000 to 215,000 for the week ending July 4, below consensusDOL — a resilient-labor-market print that supported the risk bid without disturbing rate expectations. The Treasury curve eased modestly in sympathy, the 10-Year at 4.55%, down 2 bps on the day, with the front end (3-Month at 3.78%, -3.9 bps) leading the rallyCNBC; TLT added +0.17%. The dollar was flat, DXY at 100.94, -0.05%CNBC.
Variance decomposition: live intraday — 20260709 session, bracketed against its trailing-year range. Factor returns are trailing through last close. Total cross-sectional dispersion: 47%ile of the past year.
Variance mix — % of total, today vs 1d ago vs 1-yr avg
market 77%ile style 86%ile thematic 13%ile idiosyncratic 17%ile
Variance explained — today vs. factor's trailing-year range
Marker = the factor's share of today's total variance, placed in its own trailing-year range (box 25–75%ile, ticks 90%ile and max). Amber marker = unusually load-bearing today (≥90%ile of its own year). Factor name green = up today / red = down.
| Factor | Today | 1d | 5d | 20d | 60d |
|---|---|---|---|---|---|
| Style-Risk | |||||
| Beta | +1.62% z+1.7 | +0.36% | -6.28% | -2.51% | +6.39% |
| Residual Volatility | +0.12% z+0.2 | +0.51% | +0.32% | -2.41% | +2.83% |
| Style | |||||
| Liquidity | -0.22% z-0.8 | +0.41% | +0.18% | -2.08% | +2.02% |
| Size | -0.22% z-0.6 | +0.35% | +0.66% | -0.75% | +0.87% |
| Value | +0.14% z+0.6 | -0.16% | -1.06% | -1.70% | -1.01% |
| Leverage | -0.09% z-0.5 | +0.01% | -0.82% | -0.58% | -0.59% |
| Profitability | +0.06% z+0.3 | +0.18% | -1.10% | -1.19% | -2.01% |
| Growth | +0.07% z+0.3 | -0.00% | +0.80% | +1.94% | +3.25% |
| Dividend Yield | -0.01% z-0.1 | +0.17% | -0.35% | -1.34% | +0.53% |
| Style-Momentum | |||||
| One-Day Momentum | -0.27% z-0.9 | -0.08% | -0.57% | -0.03% | +2.87% |
| Medium-Term Momentum | +0.16% z+0.5 | -0.80% | -1.90% | -0.44% | +3.42% |
| Long-Term Momentum | +0.22% z+0.3 | +1.01% | -3.07% | -0.20% | +3.28% |
| Short-Term Momentum | -0.10% z-0.3 | -0.80% | -0.75% | +0.75% | -3.18% |
| Style-Positioning | |||||
| Short Interest | -0.07% z-0.4 | -0.26% | +0.50% | +2.28% | +3.53% |
| Hedge-Fund Ownership | +0.02% z+0.1 | +0.03% | +0.41% | +1.28% | -0.42% |
| Style-Flow | |||||
| Short-Sale Activity | -0.23% z-1.8 | -0.10% | +0.52% | +0.19% | -2.82% |
| Morning Activity | -0.06% z-0.4 | +0.01% | +0.46% | -0.52% | -1.88% |
| Thematic | |||||
| Semiconductors | +0.34% z+0.6 | +1.34% | -3.28% | -1.99% | -0.59% |
| Gold | -0.16% z-0.5 | -0.35% | +1.20% | -1.29% | -7.28% |
| Oil | -0.24% z-0.5 | +1.34% | +1.13% | -3.11% | +0.62% |
| Treasury (Duration) | -0.15% z-0.4 | -0.26% | -0.57% | -0.22% | -2.22% |
| Bitcoin / Crypto | -0.11% z-0.4 | +0.19% | +0.71% | +0.39% | +1.39% |
| China | -0.09% z-0.2 | +0.30% | +0.87% | -1.48% | -6.21% |
Data compiled by FactorPulse AI; edited and verified by Jeff Klein. For informational purposes only. Does not constitute financial advice, an investment recommendation, or an offer to buy or sell any securities. Always consult a qualified financial professional before making investment decisions.
For more on factor construction methodology, see www.factorpulse.com/glossary.