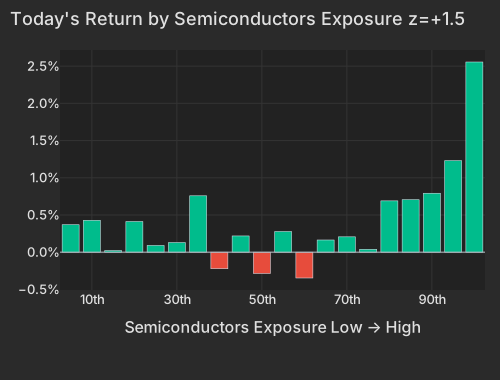
Both factors driving the tape are right-tail moves in the same cohort. The Semiconductors factor's top exposure bucket returned +2.56% and Beta's top bucket +2.92% — the most market-sensitive AI/semis names outran everything else. Crucially, the biggest names in that move decompose as factor-carried, not idiosyncratic: MU, MaxLinear, Teradyne, Astera Labs and Sandisk are all up 5–5.6% with Beta as the carrying factor and stock-specific components near zero. When a memory maker is up 5% with almost no idiosyncratic move, the correct read is "the beta complex is doing the work," not a demand story being freshly priced.
| Factor | Return | Z-Score | 5d Z | 20d Z | 63d Z | Category | Direction |
|---|---|---|---|---|---|---|---|
| Semiconductors | +0.88% | z=+1.47 | -0.01 | -0.26 | +0.46 | Thematic | High-exposure names outperformed |
| Dividend Yield | +0.27% | z=+1.45 | +0.29 | -0.92 | +0.80 | Style | Higher-payout names outperformed |
| Short-Term Momentum | -0.46% | z=-1.32 | -1.93 | -0.09 | -1.14 | Momentum | Last week's winners gave back |
| Beta | +1.06% | z=+1.09 | -1.46 | -0.12 | +1.14 | Style-Risk | High-beta names outperformed |
| Leverage | +0.13% | z=+0.71 | -0.42 | -0.91 | -0.00 | Style | More-levered names outperformed |
| Liquidity | +0.11% | z=+0.40 | +0.04 | -1.29 | +0.73 | Style | High-turnover names outperformed |
| Bucket | Avg Ret Pct |
|---|---|
| 1 | 0.37 |
| 2 | 0.43 |
| 3 | 0.02 |
| 4 | 0.41 |
| 5 | 0.09 |
| 6 | 0.13 |
| 7 | 0.76 |
| 8 | -0.22 |
| 9 | 0.22 |
| 10 | -0.29 |
| 11 | 0.28 |
| 12 | -0.35 |
| 13 | 0.16 |
| 14 | 0.21 |
| 15 | 0.04 |
| 16 | 0.69 |
| 17 | 0.71 |
| 18 | 0.79 |
| 19 | 1.23 |
| 20 | 2.56 |
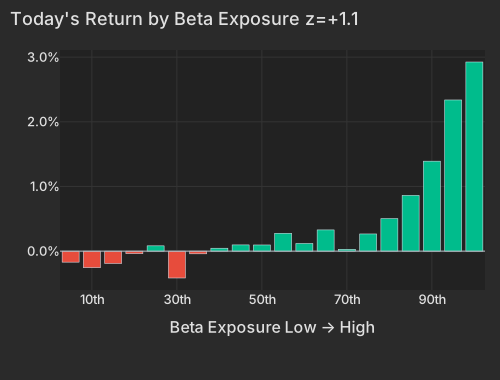
| Bucket | Avg Ret Pct |
|---|---|
| 1 | -0.17 |
| 2 | -0.26 |
| 3 | -0.19 |
| 4 | -0.04 |
| 5 | 0.08 |
| 6 | -0.41 |
| 7 | -0.04 |
| 8 | 0.05 |
| 9 | 0.10 |
| 10 | 0.10 |
| 11 | 0.28 |
| 12 | 0.12 |
| 13 | 0.33 |
| 14 | 0.03 |
| 15 | 0.27 |
| 16 | 0.50 |
| 17 | 0.86 |
| 18 | 1.39 |
| 19 | 2.34 |
| 20 | 2.92 |
The week's context makes the "bounce, not breakout" reading hard to argue with. Beta fell -3.18% over the trailing five sessions and SMH -9.59%; today simply claws part of that back. Short-Term Momentum reinforces it — at z=-1.32 the past week's laggards outpaced its winners, the mean-reversion signature of an oversold complex snapping back rather than a trend resuming.
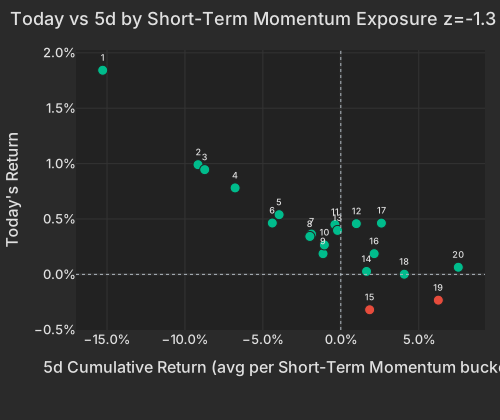
| Bucket | Ret 5D Pct | Today Ret Pct |
|---|---|---|
| 1 | -15.28 | 1.84 |
| 2 | -9.16 | 0.99 |
| 3 | -8.73 | 0.95 |
| 4 | -6.78 | 0.78 |
| 5 | -3.96 | 0.54 |
| 6 | -4.39 | 0.46 |
| 7 | -1.88 | 0.36 |
| 8 | -1.99 | 0.34 |
| 9 | -1.14 | 0.19 |
| 10 | -1.05 | 0.27 |
| 11 | -0.38 | 0.45 |
| 12 | 1.00 | 0.46 |
| 13 | -0.21 | 0.40 |
| 14 | 1.65 | 0.03 |
| 15 | 1.85 | -0.32 |
| 16 | 2.14 | 0.19 |
| 17 | 2.61 | 0.46 |
| 18 | 4.07 | 0.00 |
| 19 | 6.26 | -0.23 |
| 20 | 7.54 | 0.06 |
The narrative the wires are running — SK Hynix's US listing due this week and reports of an easing in China's access to Nvidia's H200 — is plausible, but the factor tape does not price it as a company-specific event; it prices it as broad beta. Two tells: iShares MSCI South Korea (EWY) is actually -1.22% today despite the Hynix story, and software is the clear laggard, with IGV down -1.68% against a semis complex up 1.4–3.0%.
| ETF | Theme | Today | 1d Ago | 5d Ago | 20d Ago | 63d Ago |
|---|---|---|---|---|---|---|
| SMH | semiconductors | +3.00% | +1.99% | -9.59% | -0.86% | +48.29% |
| DRAM | memory chips & storage | +2.86% | — | — | — | — |
| MTUM | momentum | +2.37% | +0.77% | -8.16% | -0.07% | +26.30% |
| AIPO | AI power infrastructure | +2.04% | +0.92% | -7.63% | -1.84% | +20.78% |
| XLK | technology | +1.41% | +1.24% | -4.79% | -1.51% | +31.99% |
| EWY | south korea | -1.22% | +0.79% | -9.50% | -1.57% | +43.66% |
| IGV | software | -1.68% | -1.75% | +2.08% | -3.31% | +14.88% |
| USO | oil | -0.21% | +3.02% | +5.42% | -16.97% | -18.74% |
The most useful thing the factor structure reveals is what a beta-only read would miss. Dividend Yield is bid just as hard as the high-beta complex — z=+1.45, sitting in the top decile of the variance it normally explains — with Bank of Montreal +5.84% its most visible name, a move that is essentially all stock-specific. High beta up and high-payout defensives up at the same time, with software the laggard and SPY only +0.23%, is not a clean risk-on switch. It is a narrow rotation back into last week's most-punished hardware names layered on top of a defensive-quality bid — the sort of two-sided breadth that flatters a factor tape without much index conviction behind it. For a PM the tradables are SMH, DRAM and AIPO on the bounce side and the dividend-quality sleeve on the other; the thing to watch after the bell is whether the beta lift survives real liquidity or fades as an oversold snap.
Against a factor-carried semis bounce, the day's genuinely high-conviction repricing is idiosyncratic and sits in pharma. AstraZeneca and Ionis shares fell after a late-stage trial of the heart drug Wainua failed to meet its primary endpoint in patients with ATTR-CM, with AstraZeneca's London shares down about 9% and Ionis off roughly 20% premarket. CNBC On our tape IONS is -22.47% — the largest stock-specific move in its trailing year — and AZN -8.13%, shedding about $23bn of market value. Removal of a competitor sent rivals higher: ALNY +17.76% and BBIO +14.25%, both near-total idiosyncratic moves. This is the counterpoint to the headline — the cleanest, best-sourced conviction today is a four-name field reshuffle, not the semis factor that tops the z-score table.
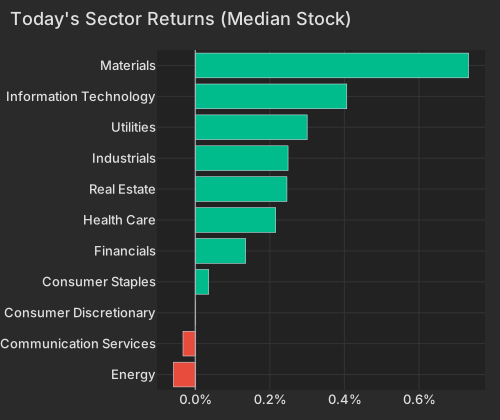
| Sector | Median Ret Pct |
|---|---|
| Energy | -0.06 |
| Communication Services | -0.03 |
| Consumer Discretionary | 0.00 |
| Consumer Staples | 0.04 |
| Financials | 0.14 |
| Health Care | 0.22 |
| Real Estate | 0.25 |
| Industrials | 0.25 |
| Utilities | 0.30 |
| Information Technology | 0.41 |
| Materials | 0.73 |
Elsewhere in single names, AZZ jumped +8.29% after a fiscal Q1 beat and reaffirmed guidance, a stock-specific industrials move. Bloomberg PepsiCo slipped -1.61% after reporting before the open, a modest staples drag. Silver firmed (SLV +1.13%) even as the IMF warned of slower global output for 2026 and China's CPI the BLS slowed more than forecast, signals that the reflation trade in industrial-linked metals may be peaking. NYT
Rates are the quiet cross-current. The ten-year Treasury yield sits at 4.587%, up 2.0 bps, while the 30-year at 5.092% is up 2.8 bps against a 2-year barely changed at 4.204% — a bear steepener, with the long end doing the moving after hawkish June FOMC the Federal Reserve minutes. CNBC TLT is down -0.34%, and the dollar is flat near 100.99. Crude is consolidating rather than extending — USO -0.21% and energy the weakest S&P sector proxy (XLE -0.27%) — even as US military strikes against Iran for a second consecutive day keep geopolitical risk elevated for energy and power-hungry AI infrastructure. Bloomberg
The Initial Claims the BLS print is due at 8:30 AM ET, with consensus at 218k versus 215k prior. It is the session's next scheduled catalyst, and after June payrolls added just 57k it is the labor read traders are watching for confirmation of cooling — a soft number would sit awkwardly against a curve that just steepened on hawkish minutes.
Variance decomposition: live intraday — 20260709 session, bracketed against its trailing-year range. Factor returns are trailing through last close. Total cross-sectional dispersion: 8%ile of the past year.
Variance mix — % of total, today vs 1d ago vs 1-yr avg
market 50%ile style 98%ile thematic 2%ile idiosyncratic 12%ile
Variance explained — today vs. factor's trailing-year range
Marker = the factor's share of today's total variance, placed in its own trailing-year range (box 25–75%ile, ticks 90%ile and max). Amber marker = unusually load-bearing today (≥90%ile of its own year). Factor name green = up today / red = down.
| Factor | Today | 1d | 5d | 20d | 60d |
|---|---|---|---|---|---|
| Style-Risk | |||||
| Beta | +1.06% z+1.1 | +0.36% | -6.28% | -2.51% | +6.39% |
| Residual Volatility | +0.09% z+0.2 | +0.51% | +0.32% | -2.41% | +2.83% |
| Style | |||||
| Dividend Yield | +0.27% z+1.4 | +0.17% | -0.35% | -1.34% | +0.53% |
| Profitability | +0.19% z+1.0 | +0.18% | -1.10% | -1.19% | -2.01% |
| Leverage | +0.13% z+0.7 | +0.01% | -0.82% | -0.58% | -0.59% |
| Value | +0.10% z+0.4 | -0.16% | -1.06% | -1.70% | -1.01% |
| Liquidity | +0.11% z+0.4 | +0.41% | +0.18% | -2.08% | +2.02% |
| Growth | +0.06% z+0.3 | -0.00% | +0.80% | +1.94% | +3.25% |
| Size | -0.03% z-0.1 | +0.35% | +0.66% | -0.75% | +0.87% |
| Style-Momentum | |||||
| Short-Term Momentum | -0.46% z-1.3 | -0.80% | -0.75% | +0.75% | -3.18% |
| Long-Term Momentum | +0.68% z+1.0 | +1.01% | -3.07% | -0.20% | +3.28% |
| Medium-Term Momentum | +0.14% z+0.5 | -0.80% | -1.90% | -0.44% | +3.42% |
| One-Day Momentum | +0.12% z+0.4 | -0.08% | -0.57% | -0.03% | +2.87% |
| Style-Positioning | |||||
| Short Interest | -0.11% z-0.6 | -0.26% | +0.50% | +2.28% | +3.53% |
| Hedge-Fund Ownership | -0.05% z-0.4 | +0.03% | +0.41% | +1.28% | -0.42% |
| Style-Flow | |||||
| Morning Activity | -0.10% z-0.7 | +0.01% | +0.46% | -0.52% | -1.88% |
| Short-Sale Activity | -0.08% z-0.6 | -0.10% | +0.52% | +0.19% | -2.82% |
| Thematic | |||||
| Semiconductors | +0.88% z+1.5 | +1.34% | -3.28% | -1.99% | -0.59% |
| Gold | -0.25% z-0.8 | -0.35% | +1.20% | -1.29% | -7.28% |
| China | -0.16% z-0.4 | +0.30% | +0.87% | -1.48% | -6.21% |
| Bitcoin / Crypto | -0.09% z-0.3 | +0.19% | +0.71% | +0.39% | +1.39% |
| Treasury (Duration) | +0.02% z+0.1 | -0.26% | -0.57% | -0.22% | -2.22% |
| Oil | +0.02% z+0.1 | +1.34% | +1.13% | -3.11% | +0.62% |
Data compiled by FactorPulse AI; edited and verified by Jeff Klein. For informational purposes only. Does not constitute financial advice, an investment recommendation, or an offer to buy or sell any securities. Always consult a qualified financial professional before making investment decisions.
For more on factor construction methodology, see www.factorpulse.com/glossary.