The catalyst is unambiguous. Samsung's preliminary Q2 showed operating profit up roughly 1,800% year-over-year on AI memory demand, but analysts flagged DRAM contract price hikes near 30% sequentially versus 40% expected, and a memory margin trailing Micron'sBloomberg. The selloff went global — the Nikkei fell 2.1% with Kioxia down 11%, and the KOSPI tripped circuit breakersEconomic Times — and spread to memory-adjacent US names, with SanDisk crashing 10%Economic Times. In our universe: Micron (MU) -5.14%, Intel (INTC) -9.08%, TSMC (TSM) -3.21%, and the Roundhill Memory ETF (DRAM) -5.49%.
| Factor | Return | Z-Score | 5d Z | 20d Z | 63d Z | Category | Direction |
|---|---|---|---|---|---|---|---|
| Profitability | -0.52% | -2.7 | -2.9 | -1.6 | -1.0 | Style | High-profitability names lagging |
| Beta | -2.49% | -2.6 | -2.2 | -0.3 | +1.3 | Style-Risk | High-beta names hit hard — reversal |
| Short Interest | +0.43% | +2.2 | +1.8 | +3.0 | +2.2 | Style-Positioning | Most-shorted names outperforming — squeeze continuation |
| Semiconductors | -0.99% | -1.7 | -3.2 | -1.1 | +0.2 | Thematic | Semis-exposed names lagging |
| Growth | +0.30% | +1.2 | +2.0 | +1.8 | +1.4 | Style | Fast growers outperforming |
| Bitcoin / Crypto | +0.43% | +1.4 | +0.7 | +0.2 | -0.2 | Thematic | Crypto-exposed names outperforming |
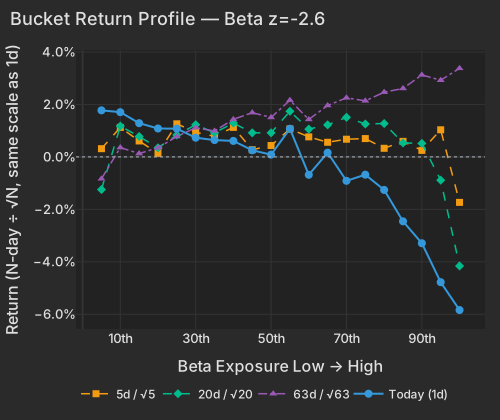
Beta is doing the heavy lifting: -2.49% today (z=-2.6), with the highest-beta bucket down 5.9% while the lowest-beta bucket is up 1.8%. Critically, this is a reversal, not continuation — the Beta factor is still +10.3% over 63 days (63d z=+1.3), and the cross-sectional slope that was near-perfectly positive over the trailing quarter flipped to near-perfectly negative today. The same complex that carried the AI run is now carrying the unwind.
| Bucket | Ret 1D Pct | Ret 5D Norm Pct | Ret 20D Norm Pct | Ret 63D Norm Pct |
|---|---|---|---|---|
| 1 | 1.77 | 0.31 | -1.24 | -0.83 |
| 2 | 1.71 | 1.12 | 1.17 | 0.36 |
| 3 | 1.29 | 0.61 | 0.78 | 0.13 |
| 4 | 1.08 | 0.13 | 0.35 | 0.35 |
| 5 | 1.08 | 1.26 | 0.83 | 0.78 |
| 6 | 0.73 | 0.94 | 1.23 | 1.11 |
| 7 | 0.64 | 0.79 | 0.92 | 0.99 |
| 8 | 0.61 | 1.12 | 1.29 | 1.43 |
| 9 | 0.25 | 0.27 | 0.92 | 1.69 |
| 10 | 0.09 | 0.44 | 0.92 | 1.50 |
| 11 | 1.07 | 1.06 | 1.74 | 2.16 |
| 12 | -0.68 | 0.76 | 1.06 | 1.43 |
| 13 | 0.16 | 0.56 | 1.22 | 1.96 |
| 14 | -0.91 | 0.67 | 1.51 | 2.25 |
| 15 | -0.68 | 0.70 | 1.25 | 2.14 |
| 16 | -1.26 | 0.33 | 1.27 | 2.47 |
| 17 | -2.46 | 0.59 | 0.53 | 2.61 |
| 18 | -3.29 | 0.25 | 0.51 | 3.12 |
| 19 | -4.78 | 1.03 | -0.89 | 2.92 |
| 20 | -5.84 | -1.73 | -4.16 | 3.38 |
The names confirm it is factor carry, not fresh fundamentals: Wolfspeed (WOLF) -9.87%, Teradyne (TER) -9.05%, MaxLinear (MXL) -8.45%, and Aehr Test (AEHR) -8.71% are all essentially pure Beta-complex moves with the stock-specific component near zero. Intel's -9.08% is likewise style-driven, with only about -2% of it the stock's own move. That mechanical character fits the positioning backdrop: Goldman Sachs prime brokerage data shows long/short gross leverage at the 2nd percentile of the past year, with tech hardware the most net-sold sector for a fourth straight weekWSJEconomic Times. Samsung didn't create the fragility; it triggered it.
The regime data makes the same point from above: the Market factor explains just 1.7% of cross-sectional variance today against a 10% one-year average, while style factors explain 42.5% versus a 19% norm — Beta alone is carrying 37% of the cross-section, in its top decile of importance. This is a high-dispersion, factor-rotation tape, not a correlated risk-off day; VXX is actually down -0.47%.
The proprietary edge is on the other side of the book. Short Interest printed +0.43% (z=+2.2) — the most heavily shorted decile outperformed the barely-shorted decile by a wide margin, with the crowded-short bucket up 2.1%. That runs contrary to the model's single most reliable persistent effect (most-shorted names normally underperform), and it is not a one-day fluke: the 20-day z is +3.0 and the 63-day z is +2.2, with the factor up +3.4% over the quarter. A multi-week squeeze regime is extending on the same session the crowded longs are being sold — the signature of de-grossing on both sides of the book rather than a directional view. Profitability adds texture: at z=-2.7 today and z=-2.9 over five days, high-quality balance sheets keep lagging the speculative cohort even on a down tape for risk.
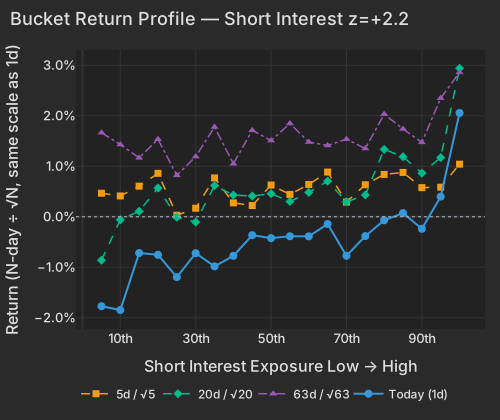
| Bucket | Ret 1D Pct | Ret 5D Norm Pct | Ret 20D Norm Pct | Ret 63D Norm Pct |
|---|---|---|---|---|
| 1 | -1.77 | 0.47 | -0.86 | 1.67 |
| 2 | -1.85 | 0.41 | -0.06 | 1.43 |
| 3 | -0.72 | 0.61 | 0.11 | 1.17 |
| 4 | -0.75 | 0.86 | 0.57 | 1.54 |
| 5 | -1.20 | 0.03 | -0.01 | 0.82 |
| 6 | -0.72 | 0.17 | -0.11 | 1.19 |
| 7 | -0.98 | 0.77 | 0.62 | 1.78 |
| 8 | -0.77 | 0.28 | 0.43 | 1.05 |
| 9 | -0.37 | 0.22 | 0.41 | 1.71 |
| 10 | -0.42 | 0.63 | 0.46 | 1.51 |
| 11 | -0.39 | 0.44 | 0.30 | 1.85 |
| 12 | -0.39 | 0.64 | 0.48 | 1.48 |
| 13 | -0.14 | 0.89 | 0.70 | 1.41 |
| 14 | -0.77 | 0.29 | 0.30 | 1.54 |
| 15 | -0.38 | 0.63 | 0.43 | 1.35 |
| 16 | -0.07 | 0.84 | 1.33 | 2.03 |
| 17 | 0.07 | 0.88 | 1.19 | 1.74 |
| 18 | -0.24 | 0.58 | 0.86 | 1.47 |
| 19 | 0.40 | 0.59 | 1.17 | 2.35 |
| 20 | 2.06 | 1.04 | 2.94 | 2.86 |
MTUM (momentum) at -2.86% on 2.0× the typical ETF pace confirms the crowded-factor unwind is being traded actively, and the pain radiates well past chips into everything the AI-infrastructure trade owned: AIPO (AI power) -4.10%, uranium (URA) -3.74%, grid equipment (GRID) -2.71%. GE Vernova (GEV) fell -7.94% — mostly its own move, after Barclays downgraded competitor Siemens Energy on peak-cycle power-equipment valuations and reports of insider selling, with the stock up 76% year-to-date coming inBloomberg.
| ETF | Theme | Today | 1d Ago | 5d Ago | 20d Ago | 63d Ago |
|---|---|---|---|---|---|---|
| SMH | semiconductors | -3.29% | +2.03% | -1.20% | -3.70% | +54.03% |
| EWY | south korea | -3.45% | +5.39% | -3.77% | -6.92% | +54.51% |
| AIPO | AI power infrastructure | -4.10% | +2.84% | -0.09% | -4.40% | +25.43% |
| MTUM | momentum | -2.86% | +1.64% | -1.24% | -1.28% | +30.86% |
| QQQ | large cap growth | -1.31% | +1.43% | +2.31% | -2.40% | +23.56% |
| SPY | large cap | -0.29% | +0.87% | +3.06% | -0.77% | +14.55% |
| XBI | biotech growth | +1.91% | +0.22% | +3.49% | +20.53% | +24.70% |
| XLV | healthcare | +1.21% | -1.09% | +1.01% | +6.50% | +10.32% |
| XLE | energy | +1.43% | -0.17% | -1.32% | -9.57% | -10.33% |
| USO | oil | +2.59% | +0.36% | -1.07% | -23.69% | -24.34% |
The bid rotated to health care (sector median +1.11%) and hard assets. Vertex agreed to acquire Crinetics (CRNX) for $85 a share in cash — a 102% premium and a $10 billion deal — sending CRNX up +98.70%, and Agios (AGIO) rose +15.41% on FDA approval of its thalassemia treatmentBloomberg — both essentially pure stock-specific moves, and both among the most heavily shorted, least profitable names in the universe, which is exactly why the Short Interest and Profitability factors printed the way they did. XBI at +1.91% is now +20.5% over 20 days.
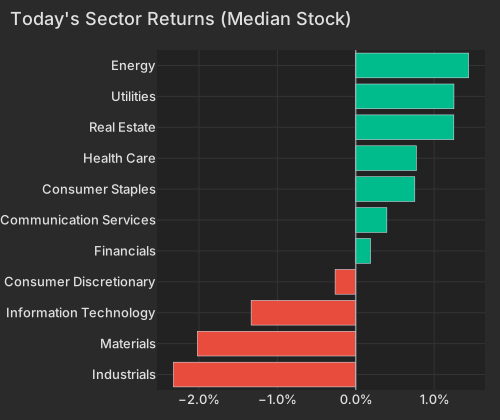
| Sector | Median Ret Pct |
|---|---|
| Industrials | -2.33 |
| Materials | -2.02 |
| Information Technology | -1.33 |
| Consumer Discretionary | -0.26 |
| Financials | 0.19 |
| Communication Services | 0.40 |
| Consumer Staples | 0.75 |
| Health Care | 0.77 |
| Real Estate | 1.25 |
| Utilities | 1.25 |
| Energy | 1.44 |
Energy is the session's second story: Iranian strikes on tankers near the Strait of Hormuz, including a Qatari LNG carrier, pushed Brent toward $73 and rebuilt a risk premium ahead of the NATO summitBloombergBloomberg. USO's +2.59% is a bounce inside a deeply broken trend (-23.7% over 20 days), and the residualized Oil factor is a muted z=+0.5 — Exxon (XOM) +2.59% and Shell (SHEL) +3.34% are being lifted more by the low-beta bid than by a genuine crude-specific repricing. Elsewhere, Deere (DE) fell -6.40% on its own move after a USDA report showed a 6% drop in wheat acreageBloomberg, and the Bitcoin/Crypto factor firmed to z=+1.4 with BITO +0.86% on 2.7× the typical ETF pace after supportive Trump comments on cryptoCNBC.
The honest dissent: SMH is still +54% over 63 days and the Semis factor's 63-day z is a neutral +0.2 — one violent session has not broken the structural AI trade, and the Goldman data shows managers harvesting gains rather than building shortsEconomic Times. But the shorter clock is running: the Semis factor's 5-day z of -3.2 and the Beta reversal say the marginal buyer of high-beta AI exposure has stepped back ahead of Q2 earnings. For a PM, the book check is the high-beta semis complex (SMH, AIPO, MU, INTC, WOLF, TER), momentum exposure via MTUM, and — on the other side — whether crowded-short positions in biotech and speculative growth (XBI, CRNX-style names) are still sized for a factor that has been squeezing for a month.
The NY Fed Survey of Consumer Expectations, released at 11:00 AM ET, showed median one-year inflation expectations rising to 3.7% from 3.5% — the highest since September 2023 — with three-year expectations at 3.3% and rent-growth expectations hitting 8.3%, firming bets on further tightening. The bond market took it badly at the long end: the 10-Year Treasury yield sits at 4.52%, up 4.2 bps todayCNBC, with the 20-Year up 4.6 bps to 5.04%CNBC against a 2.7 bps rise in the 2-Year — a modest bear steepener that pressured TLT -0.77%. The dollar firmed alongside, DXY +0.12% to 100.97CNBC.
Variance decomposition: live intraday — 20260707 session, bracketed against its trailing-year range. Factor returns are trailing through last close. Total cross-sectional dispersion: 81%ile of the past year.
Variance mix — % of total, today vs 1d ago vs 1-yr avg
market 30%ile style 97%ile thematic 61%ile idiosyncratic 13%ile
Variance explained — today vs. factor's trailing-year range
Marker = the factor's share of today's total variance, placed in its own trailing-year range (box 25–75%ile, ticks 90%ile and max). Amber marker = unusually load-bearing today (≥90%ile of its own year). Factor name green = up today / red = down.
| Factor | Today | 1d | 5d | 20d | 60d |
|---|---|---|---|---|---|
| Style-Risk | |||||
| Beta | -2.49% z-2.5 | +1.09% | -0.96% | -2.30% | +10.26% |
| Residual Volatility | +0.07% z+0.1 | -0.10% | +1.12% | -4.30% | +1.57% |
| Style | |||||
| Profitability | -0.52% z-2.7 | -0.22% | -0.79% | -0.67% | -1.36% |
| Value | -0.32% z-1.3 | -0.29% | -1.35% | -1.11% | -0.42% |
| Growth | +0.30% z+1.2 | +0.11% | +0.78% | +1.89% | +2.47% |
| Dividend Yield | +0.10% z+0.5 | -0.10% | -0.88% | -1.73% | +0.63% |
| Size | +0.13% z+0.3 | +0.32% | +0.92% | -1.49% | +0.88% |
| Liquidity | +0.07% z+0.2 | -0.14% | -0.68% | -2.17% | +1.25% |
| Leverage | -0.02% z-0.1 | -0.20% | -1.10% | -0.47% | -0.14% |
| Style-Momentum | |||||
| Short-Term Momentum | +0.28% z+0.8 | -0.06% | -0.32% | +1.05% | -1.82% |
| Medium-Term Momentum | -0.22% z-0.7 | -0.36% | -0.70% | +0.65% | +4.55% |
| One-Day Momentum | -0.22% z-0.7 | -0.39% | +0.59% | +0.16% | +4.68% |
| Long-Term Momentum | -0.39% z-0.6 | -0.02% | -2.40% | -2.02% | +3.53% |
| Style-Positioning | |||||
| Short Interest | +0.43% z+2.2 | -0.10% | +0.56% | +2.22% | +3.26% |
| Hedge-Fund Ownership | +0.17% z+1.5 | -0.05% | +0.12% | +1.00% | -0.63% |
| Style-Flow | |||||
| Morning Activity | +0.06% z+0.4 | +0.00% | +0.27% | -0.97% | -2.12% |
| Short-Sale Activity | -0.03% z-0.2 | +0.36% | +0.65% | -0.02% | -3.19% |
| Thematic | |||||
| Semiconductors | -0.99% z-1.7 | +0.02% | -2.90% | -2.80% | +0.61% |
| Bitcoin / Crypto | +0.43% z+1.4 | +0.10% | -0.03% | +0.25% | -0.01% |
| Treasury (Duration) | -0.22% z-0.6 | -0.28% | -0.63% | +0.10% | -2.26% |
| Oil | +0.25% z+0.5 | +0.32% | +0.39% | -6.01% | -1.55% |
| China | +0.19% z+0.5 | -0.01% | +0.07% | -2.57% | -6.48% |
| Gold | +0.14% z+0.4 | -0.04% | +0.69% | -1.33% | -6.53% |
Data compiled by FactorPulse AI; edited and verified by Jeff Klein. For informational purposes only. Does not constitute financial advice, an investment recommendation, or an offer to buy or sell any securities. Always consult a qualified financial professional before making investment decisions.
For more on factor construction methodology, see www.factorpulse.com/glossary.