The mechanism is clean: a geopolitical supply shock plus a yield spike is exactly the setup that punishes high-beta, long-duration equity, and that is what the residualized factor tape shows. Beta led the board at -1.22% (z=-1.25), and the move is not a one-day event — the five-day z sits at -3.6 with the factor down -7.86% over the week, so today extends an established week-long bleed in the most market-sensitive names rather than opening a new one. Growth softened in sympathy (-0.15%, z=-0.61), and the broad tape is red pre-open — QQQ -1.17%, SPY -0.88%, with the momentum ETF MTUM -2.11% and VXX +3.67%.
| Factor | Return | Z-Score | 5d Z | 20d Z | 63d Z | Category | Direction |
|---|---|---|---|---|---|---|---|
| Beta | -1.22% | -1.25 | -3.6 | -0.94 | 1.1 | Style-Risk | High-beta underperformed |
| Growth | -0.15% | -0.61 | 1.2 | 1.64 | 1.28 | Style | Faster-growth names lagged |
| Residual Volatility | -0.25% | -0.49 | -0.38 | -1.36 | 0.02 | Style-Risk | More-volatile names lagged |
| China | +0.21% | 0.51 | 0.84 | -0.86 | -1.93 | Thematic | China-exposed outperformed |
| Semiconductors | +0.25% | 0.43 | -3.29 | -1.16 | 0.28 | Thematic | Semis-exposed edged up |
| Oil | +0.11% | 0.23 | -0.08 | -1.91 | -0.78 | Thematic | Essentially flat |
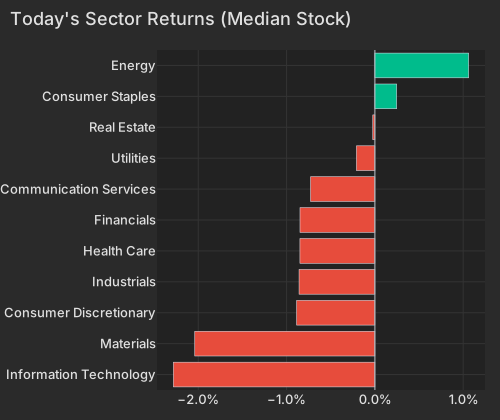
Here is the read the wires do not have: despite crude ripping, the residualized Oil factor is flat (z=0.23) and not a meaningful driver this refresh. Energy equities are the only sector bid — XLE +1.89%, XOM +1.86%, CVX +2.14%, Valero +4.62% — but decompose Valero and the move is beta and its own idiosyncratic strength (style +2.16%, stock-specific +3.25%), not oil-exposure carry. The market is buying defensive, lower-beta value energy as it sells high-beta tech; that is why Beta and Energy can point in opposite directions on the same headline.
| Sector | Median Ret Pct |
|---|---|
| Information Technology | -2.28 |
| Materials | -2.04 |
| Consumer Discretionary | -0.89 |
| Industrials | -0.86 |
| Health Care | -0.85 |
| Financials | -0.85 |
| Communication Services | -0.73 |
| Utilities | -0.21 |
| Real Estate | -0.02 |
| Consumer Staples | 0.25 |
| Energy | 1.06 |
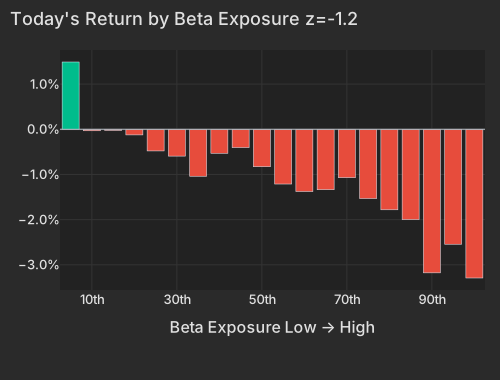
| Bucket | Avg Ret Pct |
|---|---|
| 1 | 1.49 |
| 2 | -0.03 |
| 3 | -0.02 |
| 4 | -0.12 |
| 5 | -0.48 |
| 6 | -0.59 |
| 7 | -1.04 |
| 8 | -0.53 |
| 9 | -0.41 |
| 10 | -0.83 |
| 11 | -1.21 |
| 12 | -1.38 |
| 13 | -1.34 |
| 14 | -1.07 |
| 15 | -1.53 |
| 16 | -1.78 |
| 17 | -2.00 |
| 18 | -3.18 |
| 19 | -2.54 |
| 20 | -3.29 |
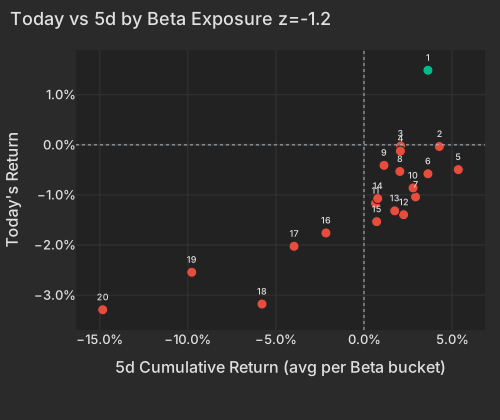
| Bucket | Ret 5D Pct | Today Ret Pct |
|---|---|---|
| 1 | 3.63 | 1.49 |
| 2 | 4.28 | -0.03 |
| 3 | 2.08 | -0.02 |
| 4 | 2.07 | -0.12 |
| 5 | 5.36 | -0.49 |
| 6 | 3.63 | -0.58 |
| 7 | 2.93 | -1.04 |
| 8 | 2.04 | -0.53 |
| 9 | 1.14 | -0.41 |
| 10 | 2.79 | -0.86 |
| 11 | 0.66 | -1.17 |
| 12 | 2.25 | -1.40 |
| 13 | 1.75 | -1.32 |
| 14 | 0.78 | -1.07 |
| 15 | 0.72 | -1.53 |
| 16 | -2.16 | -1.76 |
| 17 | -3.97 | -2.03 |
| 18 | -5.79 | -3.18 |
| 19 | -9.78 | -2.54 |
| 20 | -14.84 | -3.29 |
The yield move is real and front-loaded on the curve. The 2-year sits at 4.21%, up 5.0 bps, and the 10-year at 4.57%, up 4.4 bpsCNBC — the short end moving more than the 30-year (up 2.4 bps to 5.07%) leaves a flatter curve as markets price the inflationary risk of a Strait of Hormuz disruption. TLT is down -0.24% today and -3.32% over five sessions, and the Duration factor's small positive tilt (z=0.63) is the only whisper of a duration bid. The dollar is barely changed (DXY 101.08, +0.06%), so the crude bid is a genuine supply-premium story rather than an FX artifact.CNBC
The other structural story running underneath the geopolitics is the AI-memory complex, and today it stabilized rather than extended. South Korea's Kospi fell into a bear market on AI-chipmaker fears, dragging EWY -5.31% and the Roundhill Memory ETF DRAM -4.71%, after Samsung's record quarter triggered a sell-the-news reaction and Morgan Stanley flagged peak momentum in memory.Economic TimesFT Yet the residualized Semis factor actually ticked up (+0.25%, z=0.43) against a brutal -3.29 five-day z, and SMH's -1.83% is mild next to its -8.00% five-day slide — bargain buying is meeting the correction.
The capital leaving Asian memory is landing in Chinese internet. Alibaba is up +9.99% — its best day in roughly ten months, MarketWatch reported, after a pre-earnings update showed narrowing losses in its Taobao quick-commerce unit — and the move is almost entirely the stock's own (idiosyncratic component +10.15%, idio_z 4.99), not factor carry. Baidu +4.92%, KWEB +3.41% and FXI +3.00% round out the rotation, and the China factor's positive tilt (z=0.51) sits against a still-negative -1.93 63-day z — the group is bouncing off a deeply out-of-favor base.
| ETF | Theme | Today | 1d Ago | 5d Ago | 20d Ago | 63d Ago |
|---|---|---|---|---|---|---|
| EWY | South Korea | -5.31% | -4.51% | -8.21% | +3.48% | +43.95% |
| SMH | semiconductors | -1.83% | -3.78% | -8.00% | +2.06% | +46.84% |
| MTUM | momentum | -2.11% | -2.88% | -7.01% | +1.95% | +26.14% |
| KWEB | China internet | +3.41% | -0.31% | +4.98% | -3.30% | -9.35% |
| FXI | China large-cap | +3.00% | +0.00% | +2.46% | -6.50% | -8.61% |
| USO | oil | +2.73% | +4.38% | +1.72% | -18.12% | -21.61% |
| XLE | energy | +1.89% | +2.84% | +1.98% | -5.25% | -8.44% |
| VXX | volatility | +3.67% | +0.93% | -3.81% | -13.96% | -35.98% |
The largest single-name moves are all stock-specific, not factor-carried. Royal Bank of Canada is up +3.58% (idio_z 4.47) with the Bank of Canada expected to hold at 2.25% into its July 15 decision, a stable backdrop for Canadian financials.BANKOFCANADA On the downside, the sharpest stock-specific losses are in rate-sensitive corners the coverage only partly explains: Acadia Realty -10.85% (idio_z -7.92) is under pressure from a June forward equity offering and institutional trimming.
The one number that complicates the risk-off read is the pre-open variance mix: Market and Style together explain roughly 61% of cross-sectional variance versus a ~29% one-year norm, with idiosyncratic share unusually low. That is the opposite of a typical thin pre-open, and it says the macro shock is already propagating into correlated factor moves before the bell rather than sitting in a handful of ADRs. But the counter-signal is genuine — the Semis factor is green, Chinese internet is ripping, and the Oil factor is flat — so this is not a uniform liquidation. A PM should read it as beta and duration doing the damage while two crowded pain trades (memory, China) trade against the tape. The instruments to watch as liquidity arrives: MTUM and QQQ on the beta unwind, SMH and DRAM for whether the memory bounce holds, and KWEB/BABA for whether the China rotation has legs beyond a one-day squeeze.
Variance decomposition: live intraday — 20260708 session, bracketed against its trailing-year range. Factor returns are trailing through last close. Total cross-sectional dispersion: 10%ile of the past year.
Variance mix — % of total, today vs 1d ago vs 1-yr avg
market 91%ile style 95%ile thematic 2%ile idiosyncratic 3%ile
Variance explained — today vs. factor's trailing-year range
Marker = the factor's share of today's total variance, placed in its own trailing-year range (box 25–75%ile, ticks 90%ile and max). Amber marker = unusually load-bearing today (≥90%ile of its own year). Factor name green = up today / red = down.
| Factor | Today | 1d | 5d | 20d | 60d |
|---|---|---|---|---|---|
| Style-Risk | |||||
| Beta | -1.22% z-1.2 | -2.88% | -5.21% | -1.57% | +6.94% |
| Residual Volatility | -0.25% z-0.5 | -0.06% | +0.27% | -2.67% | +2.25% |
| Style | |||||
| Growth | -0.15% z-0.6 | +0.31% | +1.10% | +1.93% | +3.08% |
| Dividend Yield | +0.07% z+0.3 | +0.09% | -0.77% | -1.39% | +0.62% |
| Value | +0.08% z+0.3 | -0.17% | -0.99% | -1.52% | -0.93% |
| Liquidity | -0.08% z-0.3 | -0.06% | -0.66% | -2.14% | +1.52% |
| Profitability | +0.04% z+0.2 | -0.38% | -1.10% | -1.26% | -2.09% |
| Size | -0.07% z-0.2 | +0.22% | +0.52% | -0.98% | +0.84% |
| Leverage | +0.00% z+0.0 | -0.01% | -1.08% | -0.70% | -0.37% |
| Style-Momentum | |||||
| Short-Term Momentum | -0.33% z-1.0 | -0.03% | -0.49% | +1.96% | -2.09% |
| Medium-Term Momentum | -0.16% z-0.6 | -0.21% | -0.98% | +0.48% | +4.23% |
| One-Day Momentum | -0.10% z-0.3 | -0.29% | -0.08% | -0.45% | +3.38% |
| Long-Term Momentum | +0.04% z+0.1 | -0.23% | -3.58% | -0.29% | +2.75% |
| Style-Positioning | |||||
| Hedge-Fund Ownership | +0.07% z+0.6 | +0.21% | +0.34% | +1.17% | -0.44% |
| Short Interest | +0.05% z+0.3 | +0.39% | +0.73% | +2.56% | +3.43% |
| Style-Flow | |||||
| Morning Activity | -0.12% z-0.8 | +0.08% | +0.32% | -0.67% | -1.68% |
| Short-Sale Activity | +0.04% z+0.4 | +0.03% | +0.62% | +0.18% | -2.78% |
| Thematic | |||||
| Treasury (Duration) | +0.22% z+0.6 | -0.05% | -0.34% | -0.02% | -1.91% |
| Bitcoin / Crypto | -0.19% z-0.6 | +0.32% | +0.34% | +0.21% | +0.90% |
| China | +0.21% z+0.5 | +0.03% | +0.35% | -2.20% | -6.29% |
| Semiconductors | +0.25% z+0.4 | -0.65% | -3.84% | -2.45% | -1.21% |
| Oil | +0.11% z+0.2 | +0.33% | +0.15% | -3.87% | -0.29% |
| Gold | -0.07% z-0.2 | +0.11% | +1.07% | -1.46% | -6.55% |
Data compiled by FactorPulse AI; edited and verified by Jeff Klein. For informational purposes only. Does not constitute financial advice, an investment recommendation, or an offer to buy or sell any securities. Always consult a qualified financial professional before making investment decisions.
For more on factor construction methodology, see www.factorpulse.com/glossary.