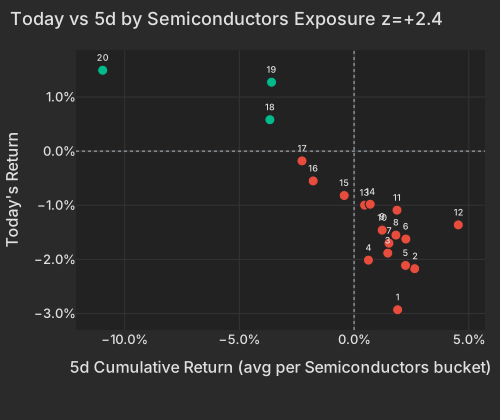
Semiconductors returned +1.44% (z=+2.4) and is carrying 46% of conditional factor importance — nothing else on the board comes close — after a five-day stretch that ran at z=-2.4 and left the factor -3.18% over the week. The pattern is a bounce inside a drawdown, not a resumption of trend: SMH is +1.72% today against -8.00% over five days (still +46.84% over 63 days), and the move is concentrated in the highest-exposure names — the top exposure bucket is +1.4%, with Marvell (MRVL) and MaxLinear (MXL) among the names carrying it. The overnight analog was explicit: Samsung and SK Hynix rebounded on bargain buying after opening down 4–5%, with SK Hynix closing +5.8%Economic Times — this after the Kospi's 20% peak-to-trough drawdown put it formally in a bear marketFT. EWY tells the same trend story stateside: -0.51% today after -8.21% over five days, on a +43.95% 63-day run.
| Bucket | Ret 5D Pct | Today Ret Pct |
|---|---|---|
| 1 | 1.90 | -2.93 |
| 2 | 2.64 | -2.17 |
| 3 | 1.47 | -1.88 |
| 4 | 0.63 | -2.01 |
| 5 | 2.24 | -2.11 |
| 6 | 2.26 | -1.62 |
| 7 | 1.52 | -1.70 |
| 8 | 1.82 | -1.55 |
| 9 | 1.23 | -1.44 |
| 10 | 1.23 | -1.46 |
| 11 | 1.87 | -1.09 |
| 12 | 4.54 | -1.36 |
| 13 | 0.46 | -1.00 |
| 14 | 0.70 | -0.98 |
| 15 | -0.43 | -0.82 |
| 16 | -1.78 | -0.55 |
| 17 | -2.27 | -0.18 |
| 18 | -3.67 | 0.58 |
| 19 | -3.60 | 1.27 |
| 20 | -10.96 | 1.50 |
| Factor | Return | Z-Score | 5d Z | 20d Z | 63d Z | Category | Direction |
|---|---|---|---|---|---|---|---|
| Semiconductors | +1.44% | +2.42 | -2.40 | -0.71 | +0.53 | Thematic | Beaten-down chip names bounced |
| Short-Term Momentum | -0.81% | -2.36 | -0.99 | +0.48 | -0.89 | Momentum | Week's winners gave back to losers |
| Medium-Term Momentum | -0.70% | -2.35 | -2.71 | -0.26 | +1.28 | Momentum | Month's winners gave back to losers |
| Oil | +1.10% | +2.18 | +0.79 | -1.48 | -0.53 | Thematic | Oil-levered names outperformed |
| Long-Term Momentum | +0.85% | +1.30 | -2.21 | -0.12 | +0.84 | Momentum | 1-year winners still outperforming |
| Short Interest | -0.27% | -1.39 | +1.14 | +2.60 | +1.94 | Positioning | Crowded shorts back to underperforming |
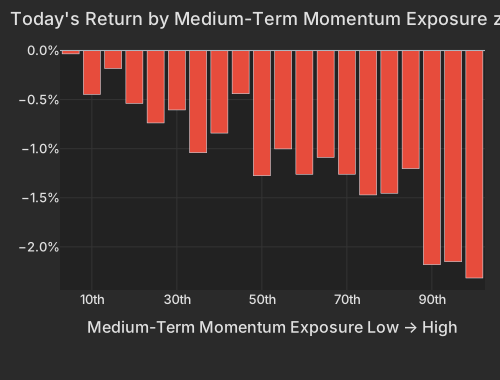
The momentum decomposition is the confirming detail. Both fast trend factors reversed hard — Short-Term Momentum -0.81% (z=-2.4), Medium-Term Momentum -0.70% (z=-2.4), with the past month's strongest winners the worst-hit cohort at -2.4% — while Long-Term Momentum ran +0.85% (z=+1.3). The unwind is in the weeks-horizon trades, not the year-long AI trade: 1-year winners still outperformed today, and the factor complex actually carried the optical-networking names — Lumentum (LITE) printed a +7.6% Long-Term Momentum-led factor contribution that was almost fully offset by a -6.5% own-move, leaving the stock near flat at +0.30%.
| Bucket | Avg Ret Pct |
|---|---|
| 1 | -0.03 |
| 2 | -0.45 |
| 3 | -0.18 |
| 4 | -0.54 |
| 5 | -0.74 |
| 6 | -0.61 |
| 7 | -1.04 |
| 8 | -0.84 |
| 9 | -0.44 |
| 10 | -1.28 |
| 11 | -1.00 |
| 12 | -1.26 |
| 13 | -1.09 |
| 14 | -1.26 |
| 15 | -1.47 |
| 16 | -1.45 |
| 17 | -1.20 |
| 18 | -2.18 |
| 19 | -2.15 |
| 20 | -2.32 |
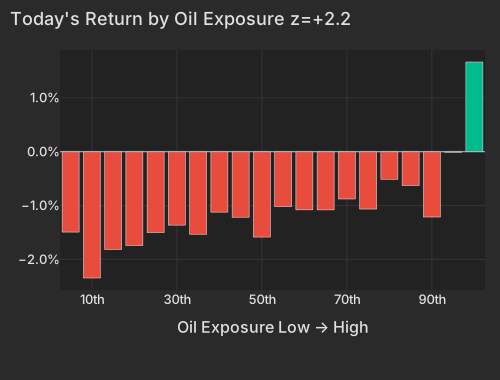
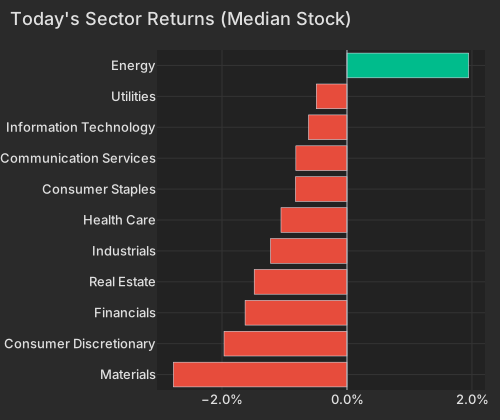
Trump declared the ceasefire with Iran "over" at the NATO summit after U.S. strikes on more than 80 Iranian targets and Iranian retaliation against U.S. sites in Bahrain and Kuwait, with Brent surging more than 5% toward $79Bloomberg. The Strait of Hormuz is back in what traders describe as full conflict conditions, with prediction markets not expecting normal shipping traffic before 2027NYT. The factor tape confirms the mechanism: Oil +1.10% (z=+2.2), with the highest-exposure bucket +1.6%. XOP is +2.53%, USO +2.36% at 3.2× the typical ETF pace, and the Energy sector's median stock is +2.01% — Valero +4.95%, Petrobras +3.57%, and refiner Par Pacific (PARR) +9.12%, most of it the stock's own move. The dollar is no help to the story either way — DXY is near flat at 100.97 (-0.05%)CNBC — this is a supply-fear bid, not a currency effect.
| Bucket | Avg Ret Pct |
|---|---|
| 1 | -1.49 |
| 2 | -2.35 |
| 3 | -1.82 |
| 4 | -1.74 |
| 5 | -1.50 |
| 6 | -1.36 |
| 7 | -1.53 |
| 8 | -1.12 |
| 9 | -1.22 |
| 10 | -1.59 |
| 11 | -1.02 |
| 12 | -1.08 |
| 13 | -1.08 |
| 14 | -0.88 |
| 15 | -1.06 |
| 16 | -0.51 |
| 17 | -0.63 |
| 18 | -1.21 |
| 19 | -0.01 |
| 20 | 1.66 |
The rates leg is what spreads the damage. The 10-year Treasury sits at 4.57%, up 4 bpsCNBC, with both the 20-year (5.08%) and 30-year (5.07%) above 5%CNBC, and the belly moving most (5-year +5.3 bps)CNBC. Behind it, June Fed minutes from Kevin Warsh's first meeting revealed a few officials arguing for a hike, and the oil shock has strategists warning Fed tightening is back in play for SeptemberBloomberg. The rate-sensitive complex is wearing it: ITB -3.50% at 3.2× the typical pace and XHB -2.85%, gold miners down (GDX -3.25%, GLD -1.08%) as the hawkish-minutes real-yield read trumps the war bid, and consumer finance getting hit hardest of all — Synchrony (SYF) -8.33% and Bread Financial (BFH) -9.13%, both mostly stock-specific (own-moves of -5.9% and -7.6%) and both accelerating into the afternoon, with BFH down -4.79% in the last hour at 4.4× pace, against a backdrop of revolving credit balances at $1.35 trillion and 21% average card ratesFederal Reserve.
| Sector | Median Ret Pct |
|---|---|
| Materials | -2.78 |
| Consumer Discretionary | -1.97 |
| Financials | -1.63 |
| Real Estate | -1.48 |
| Industrials | -1.22 |
| Health Care | -1.06 |
| Consumer Staples | -0.83 |
| Communication Services | -0.82 |
| Information Technology | -0.62 |
| Utilities | -0.49 |
| Energy | 1.95 |
The counterpoint inside the war trade: defense is selling off, not rallying. ITA is -2.40% and XAR -2.17% on the day despite live hostilities — profit-taking on a trade that is still +6.83% over 20 days, and consistent with Trump's noon NATO press conference striking a reassuring tone on alliance commitment. Tech is the other dissent from the duration-headwind script: XLK is +0.79% and SMH +1.72% with the 30-year above 5%, which says the chip bounce is positioning-driven and strong enough to override the rates impulse — for today.
| ETF | Theme | Today | 1d Ago | 5d Ago | 20d Ago | 63d Ago |
|---|---|---|---|---|---|---|
| KWEB | China internet | +3.73% | -0.31% | +4.98% | -3.30% | -9.35% |
| FXI | China large-cap | +3.14% | 0.00% | +2.46% | -6.50% | -8.61% |
| XOP | oil & gas E&P | +2.53% | +2.21% | +1.28% | -5.20% | -12.12% |
| USO | crude oil | +2.36% | +4.38% | +1.72% | -18.12% | -21.61% |
| SMH | semiconductors | +1.72% | -3.78% | -8.00% | +2.06% | +46.84% |
| EWY | South Korea | -0.51% | -4.51% | -8.21% | +3.48% | +43.95% |
| ITA | defense | -2.40% | -2.26% | +2.50% | +6.83% | +8.84% |
| GDX | gold miners | -3.25% | -3.78% | +0.11% | -3.91% | -19.25% |
| ITB | homebuilders | -3.50% | -1.42% | -3.94% | +7.50% | +9.29% |
Against an EM complex sliding on the Iran escalationBloomberg, China is the other green on the screen. Alibaba (BABA) is +11.65% — a $27.5 billion market-cap add and its sharpest one-day gain in ten monthsBloomberg — with +10.65% of it the stock's own move, the largest stock-specific move in its trailing year. The catalyst is a mark-to-market on its venture book: portfolio unicorn Zhipu AI is selling $4 billion of shares after a 1,500% rallyBloomberg. The bid is broad: KWEB +3.73% at 2.8× the typical ETF pace, FXI +3.14%, and data-center operator GDS +8.19%, again mostly stock-specific. Note the trend context — KWEB is still -9.35% over 63 days, so this is a repricing of a laggard, which is exactly what the negative fast-momentum factors are picking up.
The read the wires won't have: Short Interest's 20-day z-score of z=+2.6 marks a month in which the most heavily shorted names outperformed the barely-shorted names by +2.27% — a rare counter-run against the model's largest persistent drag. Today it reverted: the factor printed -0.27% (z=-1.4), with the crowded-short cohort underperforming again, led by biotech shorts (MRNA, IMVT among them) at -3.8% weighted — and XBI, where that cohort lives, off -1.11% after a +27.36% 20-day run. If the month-long grace period for crowded shorts is over, the pain trade flips back to the long-the-hated-names crowd. More broadly, this is an unusually factor-driven session: style factors explain 21.4% of cross-sectional variance versus an 18.8% one-year average, and four factors — Short-Term Momentum, Medium-Term Momentum, Semiconductors, and Oil — are each in the top decile of their own variance-share history. A PM should check the book's fast-momentum and semis exposure before its index beta.
One idiosyncratic mover deserves its own line: Alignment Healthcare (ALHC) is -15.94%, with -14.40% of it in the last hour at 4.7× pace, after preliminary 2027 CMS Star Ratings data showed its primary California Medicare Advantage contract downgraded from 4.5 to 3.5 stars, threatening its 5% quality bonus paymentBloomberg — worth a read-across check for other Medicare Advantage-heavy names.
The Trump NATO press conference, held at 12:00 PM ET, saw the president affirm U.S. commitment to the alliance after claiming allies agreed to accelerate defense spending beyond previous targets; the euro and U.S. equity futures stabilized as the tone shifted from confrontational to conciliatory. The reassurance is consistent with today's profit-taking in defense ETFs (ITA -2.40%) even as the Iran conflict escalates.
Variance decomposition: live intraday — 20260708 session, bracketed against its trailing-year range. Factor returns are trailing through last close. Total cross-sectional dispersion: 46%ile of the past year.
Variance mix — % of total, today vs 1d ago vs 1-yr avg
market 75%ile style 74%ile thematic 98%ile idiosyncratic 19%ile
Variance explained — today vs. factor's trailing-year range
Marker = the factor's share of today's total variance, placed in its own trailing-year range (box 25–75%ile, ticks 90%ile and max). Amber marker = unusually load-bearing today (≥90%ile of its own year). Factor name green = up today / red = down.
| Factor | Today | 1d | 5d | 20d | 60d |
|---|---|---|---|---|---|
| Style-Risk | |||||
| Residual Volatility | +0.44% z+0.8 | -0.06% | +0.27% | -2.67% | +2.25% |
| Beta | -0.04% z-0.0 | -2.88% | -5.21% | -1.57% | +6.94% |
| Style | |||||
| Profitability | +0.25% z+1.3 | -0.38% | -1.10% | -1.26% | -2.09% |
| Dividend Yield | +0.24% z+1.2 | +0.09% | -0.77% | -1.39% | +0.62% |
| Size | +0.39% z+1.0 | +0.22% | +0.52% | -0.98% | +0.84% |
| Liquidity | +0.23% z+0.8 | -0.06% | -0.66% | -2.14% | +1.52% |
| Value | -0.10% z-0.4 | -0.17% | -0.99% | -1.52% | -0.93% |
| Growth | -0.09% z-0.4 | +0.31% | +1.10% | +1.93% | +3.08% |
| Leverage | +0.02% z+0.1 | -0.01% | -1.08% | -0.70% | -0.37% |
| Style-Momentum | |||||
| Short-Term Momentum | -0.81% z-2.4 | -0.03% | -0.49% | +1.96% | -2.09% |
| Medium-Term Momentum | -0.70% z-2.4 | -0.21% | -0.98% | +0.48% | +4.23% |
| Long-Term Momentum | +0.85% z+1.3 | -0.23% | -3.58% | -0.29% | +2.75% |
| One-Day Momentum | -0.14% z-0.5 | -0.29% | -0.08% | -0.45% | +3.38% |
| Style-Positioning | |||||
| Short Interest | -0.27% z-1.4 | +0.39% | +0.73% | +2.56% | +3.43% |
| Hedge-Fund Ownership | +0.02% z+0.1 | +0.21% | +0.34% | +1.17% | -0.44% |
| Style-Flow | |||||
| Short-Sale Activity | -0.12% z-0.9 | +0.03% | +0.62% | +0.18% | -2.78% |
| Morning Activity | +0.01% z+0.1 | +0.08% | +0.32% | -0.67% | -1.68% |
| Thematic | |||||
| Semiconductors | +1.44% z+2.4 | -0.65% | -3.84% | -2.45% | -1.21% |
| Oil | +1.10% z+2.2 | +0.33% | +0.15% | -3.87% | -0.29% |
| Gold | -0.41% z-1.2 | +0.11% | +1.07% | -1.46% | -6.55% |
| China | +0.35% z+0.9 | +0.03% | +0.35% | -2.20% | -6.29% |
| Treasury (Duration) | -0.28% z-0.8 | -0.05% | -0.34% | -0.02% | -1.91% |
| Bitcoin / Crypto | +0.12% z+0.4 | +0.32% | +0.34% | +0.21% | +0.90% |
Data compiled by FactorPulse AI; edited and verified by Jeff Klein. For informational purposes only. Does not constitute financial advice, an investment recommendation, or an offer to buy or sell any securities. Always consult a qualified financial professional before making investment decisions.
For more on factor construction methodology, see www.factorpulse.com/glossary.