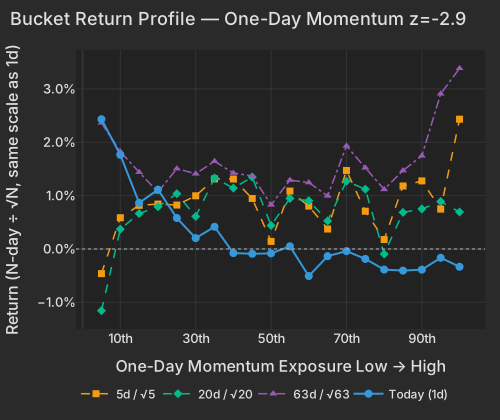
Goldman Sachs prime brokerage data flagged late June as the worst five-day stretch for systematic long/short funds since December 2023, driven by the forced unwinding of crowded algorithmic and momentum exposureBloomberg. Today the pressure released. Beta added +1.82% after a -3.82% five-day and -3.66% twenty-day run, and it alone accounts for roughly 29% of today's cross-sectional style variance — a top-decile day for the factor's importance versus its own year. One-Day Momentum printed z=-2.9: yesterday's worst decile snapped back +2.4%, an overreaction reversal that is exactly what an exhausted deleveraging looks like. Long-Term Momentum also bounced +0.96% (z=+1.5) against its own -4.04% five-day drawdown.
| Factor | Return | Z-Score | 5d Z | 20d Z | 63d Z | Category | Direction |
|---|---|---|---|---|---|---|---|
| One-Day Momentum | -0.88% | -2.9 | +0.1 | -0.2 | +1.4 | Style-Momentum | Yesterday's losers snapped back |
| Short-Sale Activity | +0.25% | +2.0 | +1.9 | -0.2 | -3.3 | Style-Flow | Reversal vs the multi-week baseline |
| Beta | +1.82% | +1.9 | -0.1 | -0.4 | +1.8 | Style-Risk | Highest-beta names led |
| Semiconductors | +1.05% | +1.8 | -1.4 | -0.7 | +0.6 | Thematic | Rebound after a week of losses |
| Short Interest | -0.31% | -1.6 | +0.8 | +2.3 | +1.7 | Style-Positioning | Most-shorted names still lagged |
| Oil | +0.78% | +1.5 | +0.8 | -2.4 | -0.7 | Thematic | Oil-exposed names bounced |
| Bucket | Ret 1D Pct | Ret 5D Norm Pct | Ret 20D Norm Pct | Ret 63D Norm Pct |
|---|---|---|---|---|
| 1 | 2.43 | -0.46 | -1.16 | 2.37 |
| 2 | 1.77 | 0.59 | 0.37 | 1.82 |
| 3 | 0.87 | 0.82 | 0.66 | 1.44 |
| 4 | 1.11 | 0.84 | 0.79 | 1.07 |
| 5 | 0.58 | 0.82 | 1.04 | 1.51 |
| 6 | 0.20 | 1.00 | 0.61 | 1.41 |
| 7 | 0.42 | 1.31 | 1.33 | 1.64 |
| 8 | -0.08 | 1.31 | 1.14 | 1.42 |
| 9 | -0.09 | 0.95 | 1.35 | 1.37 |
| 10 | -0.08 | 0.14 | 0.44 | 0.83 |
| 11 | 0.05 | 1.09 | 0.95 | 1.29 |
| 12 | -0.51 | 0.80 | 0.91 | 1.25 |
| 13 | -0.13 | 0.37 | 0.53 | 1.00 |
| 14 | -0.04 | 1.47 | 1.27 | 1.93 |
| 15 | -0.19 | 0.71 | 1.12 | 1.52 |
| 16 | -0.39 | 0.18 | -0.09 | 1.12 |
| 17 | -0.41 | 1.18 | 0.69 | 1.47 |
| 18 | -0.39 | 1.28 | 0.75 | 1.75 |
| 19 | -0.17 | 0.75 | 0.89 | 2.91 |
| 20 | -0.33 | 2.43 | 0.69 | 3.39 |
The snapback is concentrated where the unwind hit hardest: semiconductors and momentum vehicles. The Semiconductors factor is +1.05% (z=+1.8) after a -1.86% five-day run, with the highest-exposure bucket +3.9%. In single names, AMD is +9.79% — roughly half factor carry (style contribution +4.9 points, mostly Beta) and half the stock's own move — while TSM +5.32% and AVGO +5.26% round out the complex. The purest factor-carried movers make the point cleanly: MaxLinear (MXL) +10.45%, Seagate (STX) +7.56% and Sandisk (SNDK) +4.14% are almost entirely beta and momentum carry with negligible company-specific contribution. South Korea is the sharpest geographic expression — EWY +6.04% today against a five-day -12.13% — on the day SK Hynix launched a record $28 billion US listing to fund AI memory-chip expansionBloomberg.
| ETF | Theme | Today | 1d Ago | 5d Ago | 20d Ago | 63d Ago |
|---|---|---|---|---|---|---|
| EWY | south korea | +6.04% | -2.89% | -12.13% | -15.41% | +42.72% |
| SMH | semiconductors | +3.87% | -4.54% | -7.00% | -7.15% | +51.11% |
| MTUM | momentum | +3.08% | -3.53% | -6.71% | -3.94% | +29.07% |
| XLK | technology | +2.70% | -2.71% | -2.16% | -7.97% | +33.86% |
| QQQ | large cap growth | +1.67% | -1.73% | -0.53% | -4.25% | +21.96% |
| SPY | large cap | +0.65% | -0.13% | +1.43% | -1.25% | +13.67% |
| XLV | healthcare | -1.63% | +2.63% | +5.21% | +10.97% | +10.84% |
| XLP | consumer staples | -1.73% | +2.03% | +1.25% | +3.44% | +4.33% |
| ITB | homebuilders | -2.19% | +0.74% | -1.29% | +11.29% | +13.05% |
Note the pattern down the "Today" column against the "5d Ago" and "20d Ago" columns: today's leaders are the last month's losers, and vice versa, ETF by ETF. SPY at +0.65% and DIA at -0.09% confirm the index is a bystander.
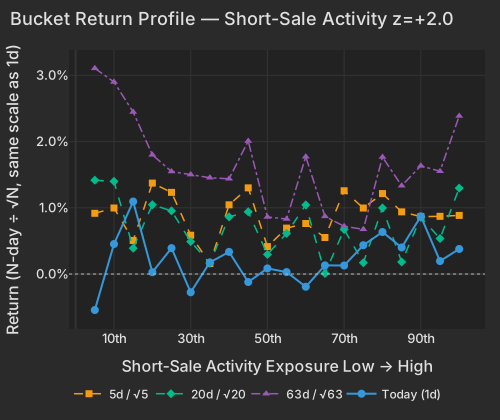
Here is the read the headline rebound hides. Short-Sale Activity printed z=+2.0: yesterday's most heavily short-sold names outperformed the barely-shorted cohort, running against the model's most statistically reliable baseline — and against a 63-day factor z of -3.3, its second week counter-trend (five-day z +1.9). The fast short-sale flow that profited all through the June drawdown is now losing money T+1. Yet Short Interest went the other way at z=-1.6: the names with the heaviest standing short interest still underperformed the un-shorted names, extending a twenty-day run at z=+2.3. The divergence is the diagnosis — the reversal is hitting the fast tactical flow, not the accumulated crowded-short cohort. This is a beta and momentum snapback, and the most-shorted, lowest-quality end of the tape is not participating. Anyone reading today as broad risk appetite should check that distinction against their book.
| Bucket | Ret 1D Pct | Ret 5D Norm Pct | Ret 20D Norm Pct | Ret 63D Norm Pct |
|---|---|---|---|---|
| 1 | -0.54 | 0.92 | 1.42 | 3.11 |
| 2 | 0.45 | 1.00 | 1.40 | 2.90 |
| 3 | 1.10 | 0.51 | 0.39 | 2.45 |
| 4 | 0.03 | 1.37 | 1.05 | 1.80 |
| 5 | 0.39 | 1.23 | 0.95 | 1.55 |
| 6 | -0.28 | 0.59 | 0.49 | 1.50 |
| 7 | 0.18 | 0.16 | 0.16 | 1.45 |
| 8 | 0.33 | 1.05 | 0.86 | 1.44 |
| 9 | -0.12 | 1.30 | 0.94 | 2.01 |
| 10 | 0.09 | 0.41 | 0.30 | 0.86 |
| 11 | 0.03 | 0.69 | 0.61 | 0.83 |
| 12 | -0.19 | 0.76 | 1.04 | 1.77 |
| 13 | 0.13 | 0.55 | 0.01 | 0.87 |
| 14 | 0.13 | 1.26 | 0.67 | 0.72 |
| 15 | 0.44 | 1.00 | 0.17 | 0.68 |
| 16 | 0.63 | 1.21 | 1.00 | 1.77 |
| 17 | 0.40 | 0.94 | 0.18 | 1.33 |
| 18 | 0.87 | 0.87 | 0.86 | 1.63 |
| 19 | 0.20 | 0.87 | 0.54 | 1.55 |
| 20 | 0.38 | 0.89 | 1.30 | 2.39 |
The regime data says treat today as a release valve, not a new trend. Style factors explain 47% of cross-sectional variance versus a 19% one-year average — the second straight day above 42% — while the market component explains just 2% against a 10% norm: an unusually high-dispersion, factor-dominated tape where single-stock hedges matter more than index hedges. And Beta's five-day (-3.82%) and twenty-day (-3.66%) runs are still negative; one z=+1.9 day has not repaired the trend it is reversing.
The other side of the rotation is unambiguous. Healthcare gave back -1.63% on XLV after a +5.21% five-day run that Bloomberg flagged as the sector's strongest weekly gain since 2022Bloomberg, with AZN -3.92% and NVS -3.06%. Consumer staples fell -1.73% on XLP at twice the typical ETF session pace, with PG -2.14% and KO -1.55%; homebuilders (ITB -2.19%) and real estate (XLRE -0.98%, also 2× pace) rounded out the funding sources.
| Sector | Median Ret Pct |
|---|---|
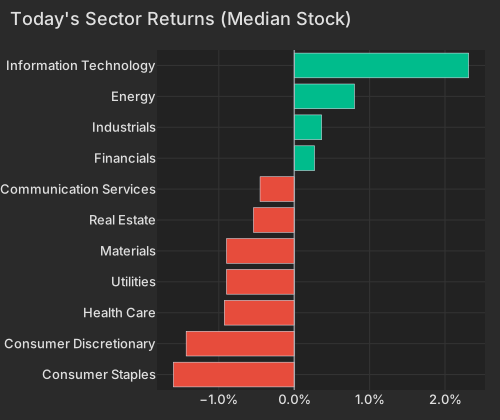
| Consumer Staples | -1.60 |
| Consumer Discretionary | -1.43 |
| Health Care | -0.93 |
| Utilities | -0.90 |
| Materials | -0.90 |
| Real Estate | -0.54 |
| Communication Services | -0.45 |
| Financials | 0.27 |
| Industrials | 0.36 |
| Energy | 0.80 |
| Information Technology | 2.31 |
Two cross-currents deserve a line each. Crude extended its slide below $72 on Brent after OPEC+ confirmed an August production increase and tanker flows through the Strait of Hormuz normalizedEconomic TimesBloomberg — yet the Oil factor is +0.78% (z=+1.5) as oil-exposed equities bounce against a twenty-day factor z of -2.4; XLE at +0.16% versus a twenty-day -9.35% says equity energy has already paid the war-premium round-trip. And in single names, Tenable (TENB) is +8.38% — almost entirely the stock's own move — on reports it is exploring a saleBloomberg, while Honda (HMC) added +5.19%, also idiosyncratic, on record June US sales and a weakening yenBloomberg. The one unexplained mover: O'Reilly Automotive (ORLY) is -7.48%, the largest stock-specific move in its trailing year, with no story yet in the coverage — the market is repricing the name on its own and the driver isn't public.
Rates and the dollar are not part of today's story: the ten-year Treasury yield sits at 4.485%, up less than a basis pointCNBC, and DXY is at 101.09, +0.24% on the sessionCNBC.
The instruments that embody the thesis: SMH and MTUM for whether the snapback extends past one session; EWY for the Korea/memory-chip leg; XLV and XLP for whether the defensive unwind persists; and the Beta-carried cohort — MXL, STX, SNDK, AMD — for how much of today survives without company-specific news. If Short Interest flips positive alongside Short-Sale Activity, the unwind is broadening into the crowded-short cohort and the risk regime changes; today it has not.
The ISM Non-Manufacturing report, released at 10:00 AM ET, showed the headline index at 54.0% — a touch below the 54.1% consensus and down from May's 54.5% — but with the Prices Index dropping 3.6 points to 67.7%, the lowest since February, and the Employment Index returning to expansion at 51.2%. The New York Fed's Global Supply Chain Pressure Index, also at 10:00 AM ET, held flat at 1.77 for June — still roughly 1.8 standard deviations above its historical mean on lingering Strait of Hormuz disruptions, though down from April's peak.
Variance decomposition: live intraday — 20260706 session, bracketed against its trailing-year range. Factor returns are trailing through last close. Total cross-sectional dispersion: 52%ile of the past year.
Variance mix — % of total, today vs 1d ago vs 1-yr avg
market 35%ile style 99%ile thematic 39%ile idiosyncratic 10%ile
Variance explained — today vs. factor's trailing-year range
Marker = the factor's share of today's total variance, placed in its own trailing-year range (box 25–75%ile, ticks 90%ile and max). Amber marker = unusually load-bearing today (≥90%ile of its own year). Factor name green = up today / red = down.
| Factor | Today | 1d | 5d | 20d | 60d |
|---|---|---|---|---|---|
| Style-Risk | |||||
| Beta | +1.82% z+1.9 | -2.81% | -3.82% | -3.66% | +11.57% |
| Residual Volatility | +0.14% z+0.3 | -0.29% | +1.93% | -4.44% | +0.48% |
| Style | |||||
| Dividend Yield | +0.20% z+1.1 | -0.31% | -1.15% | -1.59% | +0.55% |
| Value | -0.26% z-1.1 | -0.20% | -1.44% | -0.76% | +0.07% |
| Profitability | -0.20% z-1.0 | -0.30% | -0.96% | -0.85% | -0.61% |
| Size | +0.27% z+0.7 | -0.05% | -0.16% | -2.03% | +0.84% |
| Growth | +0.11% z+0.5 | -0.06% | +0.77% | +1.84% | +2.23% |
| Leverage | -0.06% z-0.3 | -0.11% | -1.15% | -0.31% | +0.33% |
| Liquidity | -0.08% z-0.3 | -0.29% | -0.15% | -2.04% | +0.74% |
| Style-Momentum | |||||
| One-Day Momentum | -0.88% z-2.9 | +0.56% | +0.38% | +0.27% | +4.52% |
| Long-Term Momentum | +0.96% z+1.5 | -1.60% | -4.04% | -2.81% | +3.79% |
| Medium-Term Momentum | -0.39% z-1.3 | -0.03% | -0.21% | +0.95% | +4.28% |
| Short-Term Momentum | -0.36% z-1.1 | -0.15% | -0.07% | +0.52% | -1.52% |
| Style-Positioning | |||||
| Hedge-Fund Ownership | -0.18% z-1.6 | +0.04% | +0.47% | +1.11% | -0.64% |
| Short Interest | -0.31% z-1.6 | +0.23% | +0.93% | +2.36% | +2.99% |
| Style-Flow | |||||
| Short-Sale Activity | +0.25% z+2.0 | +0.20% | +0.34% | -0.34% | -3.56% |
| Morning Activity | -0.10% z-0.6 | +0.25% | +0.33% | -1.10% | -2.18% |
| Thematic | |||||
| Semiconductors | +1.05% z+1.8 | -1.59% | -4.89% | -3.68% | +1.68% |
| Oil | +0.78% z+1.5 | -0.87% | -0.08% | -6.90% | -3.89% |
| Treasury (Duration) | -0.37% z-1.1 | +0.35% | -0.21% | +0.35% | -2.08% |
| Gold | -0.28% z-0.8 | +1.09% | +0.95% | -1.00% | -6.36% |
| Bitcoin / Crypto | +0.04% z+0.1 | +0.25% | +0.13% | +0.23% | -0.88% |
| China | +0.04% z+0.1 | +0.15% | +0.24% | -2.47% | -6.51% |
Data compiled by FactorPulse AI; edited and verified by Jeff Klein. For informational purposes only. Does not constitute financial advice, an investment recommendation, or an offer to buy or sell any securities. Always consult a qualified financial professional before making investment decisions.
For more on factor construction methodology, see www.factorpulse.com/glossary.