| Factor | Return | Z-Score | 5d Z | 20d Z | 63d Z | Category | Direction |
|---|---|---|---|---|---|---|---|
| Short Interest | +0.57% | z=+3.72 | z=+2.91 | z=+1.44 | z=+1.37 | Dynamics | highly shorted names outperform |
| China | -0.61% | z=-2.32 | -0.55 | z=-1.36 | z=-1.45 | Theme | china exposure underperforms |
| 1DayTrend | +0.75% | z=+2.03 | z=+2.07 | z=+1.87 | z=+1.48 | Style | 1-day moves trend |
| Growth | +0.49% | z=+1.88 | z=+1.21 | 0.61 | 0.00 | Style | growth outperforms |
| Momentum (252d) | -1.28% | z=-1.72 | -0.87 | 0.05 | 0.50 | Style | 1-year moves reverse |
Today’s cross-sectional unwind traces directly to enterprise hardware. Dell Technologies (DELL) shares rose +28.85% after securing $24.4 billion in new AI server orders and raising its annual AI server revenue target to $60 billionBloomberg. Simultaneously, NetApp (NTAP) climbed +26.45% on a Q4 earnings beat driven by record all-flash array recurring revenueBusiness Wire.
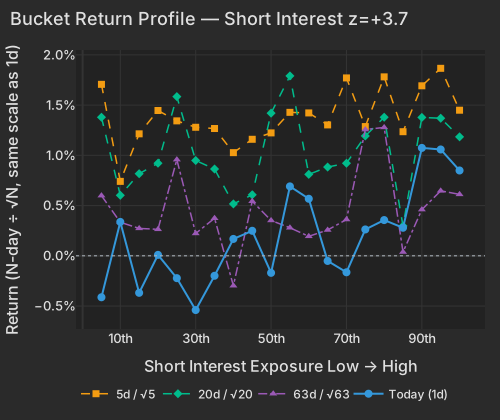
This event triggered a positioning unwind, making the Short Interest factor (z=+3.72) the session's primary driver. Highly shorted equities are systematically outperforming, squeezing bearish positions across the software and hardware sectors. NetApp carries a 4.2 standard deviation exposure to the Short Interest factor, leading the heavily shorted enterprise complex higher. The FR US Most Shorted Index gained over 4% in responseFinancial Times.
| Bucket | Ret 1D Pct | Ret 5D Norm Pct | Ret 20D Norm Pct | Ret 63D Norm Pct |
|---|---|---|---|---|
| 1 | -0.41 | 1.71 | 1.38 | 0.60 |
| 2 | 0.34 | 0.74 | 0.60 | 0.33 |
| 3 | -0.37 | 1.21 | 0.82 | 0.27 |
| 4 | 0.01 | 1.45 | 0.92 | 0.26 |
| 5 | -0.22 | 1.34 | 1.58 | 0.96 |
| 6 | -0.54 | 1.28 | 0.95 | 0.22 |
| 7 | -0.20 | 1.27 | 0.86 | 0.37 |
| 8 | 0.17 | 1.03 | 0.52 | -0.30 |
| 9 | 0.25 | 1.16 | 0.61 | 0.54 |
| 10 | -0.17 | 1.22 | 1.42 | 0.35 |
| 11 | 0.69 | 1.43 | 1.79 | 0.28 |
| 12 | 0.57 | 1.42 | 0.81 | 0.19 |
| 13 | -0.05 | 1.30 | 0.88 | 0.26 |
| 14 | -0.16 | 1.77 | 0.92 | 0.36 |
| 15 | 0.26 | 1.29 | 1.19 | 1.26 |
| 16 | 0.36 | 1.78 | 1.38 | 1.28 |
| 17 | 0.28 | 1.24 | 0.30 | 0.04 |
| 18 | 1.07 | 1.69 | 1.38 | 0.46 |
| 19 | 1.06 | 1.87 | 1.37 | 0.65 |
| 20 | 0.85 | 1.45 | 1.18 | 0.61 |
The ripple effects are visible in ETF flows, where the software-focused IGV ETF gained +5.39% on 2.2 times its average volume. The technology rotation is heavily favoring laggards: ServiceNow (NOW) gained +13.41%Morningstar, and Oracle (ORCL) rose +9.12% following a multi-billion dollar U.S. government AI cloud deal. Semiconductor names without a direct catalyst also advanced; ARM added +5.99%, with +2.82% of the gain occurring in the final hour on elevated volume.
| ETF | Theme | Today | 5d Ago | 20d Ago | 63d Ago |
|---|---|---|---|---|---|
| IGV (2.2× vol) | software | +5.39% | +2.53% | +13.23% | +15.84% |
| GDX | gold | +2.38% | +0.95% | +1.11% | -23.45% |
| XLK | technology | +1.91% | +5.48% | +17.43% | +32.51% |
| KWEB | china | +0.66% | -5.19% | -4.82% | -15.26% |
| USO | oil | -2.73% | -9.35% | -13.18% | +63.95% |
The short squeeze is taxing established momentum leaders. The 1-year Momentum factor (ret_252d) reversed to z=-1.72. This breaks its 63-day trend (z=+0.50). Investors are selling high-momentum technology stocks to fund software short-covering, dragging the right tail of the momentum distribution down by -2.7%. When the Short Interest factor reaches these extremes, factor neutralization becomes difficult for long-short portfolios tilted toward trailing 12-month winners.
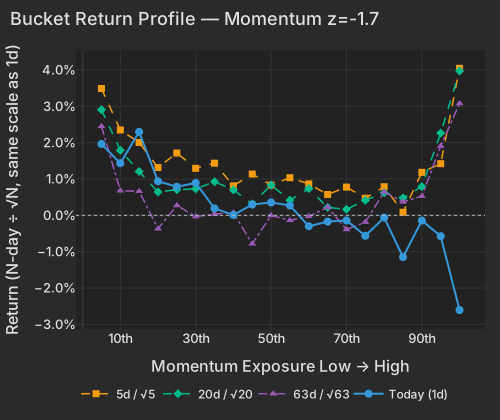
| Bucket | Ret 1D Pct | Ret 5D Norm Pct | Ret 20D Norm Pct | Ret 63D Norm Pct |
|---|---|---|---|---|
| 1 | 1.96 | 3.49 | 2.91 | 2.45 |
| 2 | 1.44 | 2.35 | 1.79 | 0.68 |
| 3 | 2.30 | 2.01 | 1.21 | 0.66 |
| 4 | 0.94 | 1.32 | 0.64 | -0.37 |
| 5 | 0.79 | 1.72 | 0.71 | 0.27 |
| 6 | 0.89 | 1.29 | 0.73 | -0.03 |
| 7 | 0.19 | 1.44 | 0.93 | 0.04 |
| 8 | 0.01 | 0.81 | 0.70 | 0.07 |
| 9 | 0.30 | 1.14 | 0.32 | -0.78 |
| 10 | 0.36 | 0.83 | 0.83 | -0.00 |
| 11 | 0.27 | 1.04 | 0.42 | -0.14 |
| 12 | -0.30 | 0.87 | 0.74 | -0.03 |
| 13 | -0.17 | 0.57 | 0.22 | 0.22 |
| 14 | -0.14 | 0.78 | 0.17 | -0.39 |
| 15 | -0.56 | 0.47 | 0.41 | -0.19 |
| 16 | -0.06 | 0.79 | 0.62 | 0.64 |
| 17 | -1.15 | 0.09 | 0.48 | 0.37 |
| 18 | -0.14 | 1.18 | 0.79 | 0.53 |
| 19 | -0.57 | 1.42 | 2.27 | 1.91 |
| 20 | -2.60 | 4.05 | 3.97 | 3.08 |
Macro factors are overriding equity beta in global markets. The China factor is notably negative at z=-2.32, weighing on ADRs. The decline follows a CSRC enforcement action against offshore brokerages, targeting unauthorized capital outflows estimated at $1.04 trillion in 2025. The policy mandates a two-year liquidation period for unauthorized accounts, pushing the KraneShares CSI China Internet ETF (KWEB) down -15.26% over the trailing 63 days.
The energy sector also declined. Oil prices fell following reports of a tentative U.S.-Iran ceasefire extension aimed at restoring shipping traffic in the Strait of HormuzBloomberg. The United States Oil Fund (USO) fell -2.73% on the day. However, the UAE's formal exit from OPEC has removed approximately 4.85 million bpd of capacity from cartel quotas, maintaining structural supply uncertaintyEconomic Times.
PCE inflation reached its highest level since 2023, prompting Federal Reserve Governor Michelle Bowman to warn against further interest rate hikesCNBC. With the U.S. Dollar Index (DXY) easing -0.17% to 98.85CNBC, gold is acting as a tail-risk hedge. The VanEck Gold Miners ETF (GDX) gained +2.38%, and the 10-Year Treasury yield declined 2.1 basis points to 4.43%CNBC.
AST SpaceMobile (ASTS) shares declined following the explosion of a Blue Origin New Glenn rocket prototype during a ground test at Cape CanaveralFinancial Times. Because ASTS relies on a multi-launch agreement with Blue Origin for its Block 2 BlueBird satellite deployments, the incident pushes manifest timelines into 2027, increasing liquidity riskBarron's.
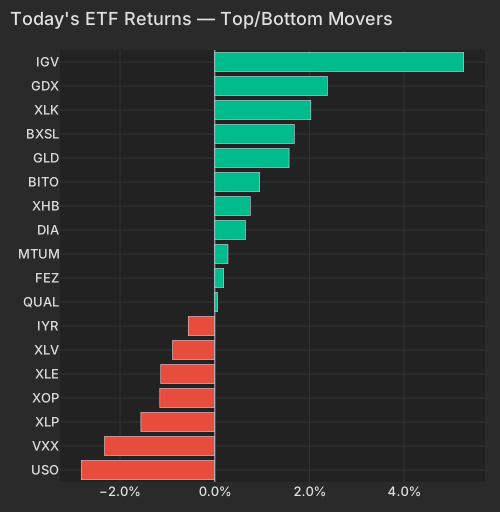
| Sym | Theme | Ret Today Pct | Vol Pace |
|---|---|---|---|
| USO | energy + cyclical | -2.82 | 1.02 |
| VXX | uncertainty | -2.33 | 0.88 |
| XLP | defensive | -1.56 | 0.92 |
| XOP | energy + cyclical | -1.16 | 1.01 |
| XLE | cyclical | -1.14 | 0.84 |
| XLV | defensive | -0.89 | 1.76 |
| IYR | rates | -0.56 | 1.42 |
| QUAL | quality | 0.06 | 2.87 |
| FEZ | international | 0.19 | 1.47 |
| MTUM | momentum | 0.28 | 1.58 |
| DIA | size | 0.65 | 1.53 |
| XHB | cyclical + rates | 0.75 | 1.37 |
| BITO | retail + currency | 0.95 | 1.31 |
| GLD | currency | 1.57 | 1.54 |
| BXSL | credit | 1.68 | 0.75 |
| XLK | growth | 2.03 | 1.27 |
| GDX | currency | 2.38 | 1.11 |
| IGV | cyclical | 5.26 | 2.20 |
MSCI Rebalance Effective at Close: Passive funds face elevated turnover today as the MSCI ACWI Index implements its semi-annual rebalance with 49 additions and 101 deletionsMSCI. Enhanced free float rounding methodologies are expected to drive billions in targeted passive flows during the Market-on-Close auction.
New York Fed Staff Nowcast: The Q2 2026 GDP growth nowcast remained steady at 2.6% in today's updatenewyorkfed.org. Resilience in housing starts and building permits successfully offset localized drags from the Philadelphia Fed Manufacturing Survey.
Data compiled by FactorPulse AI; edited and verified by Jeff Klein. For informational purposes only. Does not constitute financial advice, an investment recommendation, or an offer to buy or sell any securities. Always consult a qualified financial professional before making investment decisions.
For more on factor construction methodology, see www.factorpulse.com/glossary.