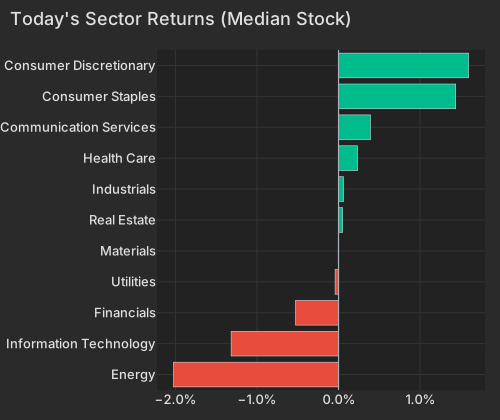
Oil prices fell as U.S. and Iranian delegations convened in Qatar to advance a diplomatic framework aimed at reopening the Strait of Hormuz, according to the NYT. The resulting unwind in geopolitical risk pricing sent USO down -4.33%, dragging the broader Energy Select Sector SPDR (XLE) down -1.28%. The Oil thematic factor is right-tail driven on the downside today, punishing energy exploration and production constituents like APA and SM Energy, according to The Guardian.
| Sector | Median Ret Pct |
|---|---|
| Energy | -2.03 |
| Information Technology | -1.32 |
| Financials | -0.53 |
| Utilities | -0.04 |
| Materials | -0.00 |
| Real Estate | 0.05 |
| Industrials | 0.06 |
| Health Care | 0.23 |
| Communication Services | 0.39 |
| Consumer Staples | 1.44 |
| Consumer Discretionary | 1.60 |
The commodity sell-off eased inflation fears, pulling the 10-Year Treasury yield down 1.2 bps to 4.479%, according to the Fed. This rate relief registered on the factor tape, with the Treasury exposure factor outperforming at z=+0.93 and long-duration thematic proxies like the SPDR S&P Homebuilders ETF (XHB) rising +0.96%.
| Factor | Return | Z-Score | 5d Z | 20d Z | 63d Z | Category | Direction |
|---|---|---|---|---|---|---|---|
| China | +0.56% | z=+2.23 | +0.79 | -0.89 | -1.44 | Theme | china exposure outperforms |
| Short Interest | +0.33% | z=+2.23 | +0.50 | +0.20 | +0.54 | Dynamics | highly shorted names outperform |
| Value | +0.42% | z=+1.68 | z=+1.13 | z=-1.05 | +0.16 | Style | lower P/E outperforms |
| Profitability | -0.26% | z=-1.61 | z=-1.15 | -0.63 | -0.39 | Style | unprofitable names outperform |
| Treasury | +0.22% | +0.93 | z=+2.38 | -0.99 | -0.99 | Theme | treasury exposure outperforms |
| Short Sale | +0.05% | +0.33 | -0.82 | z=-2.38 | z=-4.78 | Dynamics | prior-day shorts outperform next day |
While the headline indices printed gains, internal factor flows revealed a low-quality short squeeze. The Short Interest factor rose notably to z=+2.23, driven by buying in the biotech and consumer discretionary left-tails. Simultaneously, the Profitability factor declined to z=-1.61, signaling a rotation into unprofitable enterprises. This speculative move cuts directly against prevailing regimes: over the last 63 trading days, the Short Sale factor printed an extreme z=-4.78, meaning short sellers generated consistent alpha for months. Today's session marks an acute reversal for that cohort.
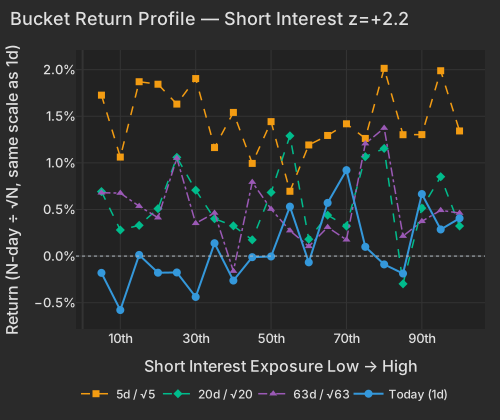
| Bucket | Ret 1D Pct | Ret 5D Norm Pct | Ret 20D Norm Pct | Ret 63D Norm Pct |
|---|---|---|---|---|
| 1 | -0.18 | 1.73 | 0.69 | 0.68 |
| 2 | -0.58 | 1.06 | 0.28 | 0.68 |
| 3 | 0.01 | 1.87 | 0.33 | 0.54 |
| 4 | -0.18 | 1.84 | 0.51 | 0.41 |
| 5 | -0.18 | 1.63 | 1.06 | 1.05 |
| 6 | -0.44 | 1.90 | 0.71 | 0.35 |
| 7 | 0.14 | 1.16 | 0.40 | 0.46 |
| 8 | -0.26 | 1.54 | 0.32 | -0.16 |
| 9 | -0.01 | 0.99 | 0.17 | 0.79 |
| 10 | -0.00 | 1.44 | 0.68 | 0.50 |
| 11 | 0.53 | 0.70 | 1.29 | 0.27 |
| 12 | -0.07 | 1.19 | 0.18 | 0.10 |
| 13 | 0.57 | 1.29 | 0.44 | 0.31 |
| 14 | 0.92 | 1.42 | 0.32 | 0.17 |
| 15 | 0.10 | 1.26 | 1.07 | 1.21 |
| 16 | -0.09 | 2.01 | 1.15 | 1.37 |
| 17 | -0.19 | 1.30 | -0.30 | 0.21 |
| 18 | 0.67 | 1.30 | 0.51 | 0.37 |
| 19 | 0.29 | 1.99 | 0.85 | 0.49 |
| 20 | 0.41 | 1.34 | 0.32 | 0.46 |
The ETF landscape reflects this positioning shift. Growth and thematic innovation vehicles caught bids while defensive, low-volatility, and energy allocations declined.
| ETF | Theme | Today | 5d | 20d | 63d |
|---|---|---|---|---|---|
| XLY | consumer discretionary | +1.85% | +2.69% | +1.37% | +2.32% |
| ARKK | innovation growth | +0.96% | +3.65% | +0.89% | +7.16% |
| XHB | homebuilders | +0.96% | +6.15% | -5.58% | -12.69% |
| USMV | minimum volatility | -0.45% | +0.51% | +3.12% | +0.10% |
| XLE | energy | -1.28% | -4.51% | +1.90% | +4.99% |
| USO | oil | -4.33% | -8.23% | +1.69% | +69.64% |
Idiosyncratic megacap tech catalysts continued to drive institutional volume. Micron (MU) rose +8.38% intraday, officially entering the $1 trillion market cap club, according to Reuters. The fundamental driver remains capacity scarcity: 2026 HBM4 capacity is fully sold out under binding contracts, establishing pricing power for the hardware layer.
Conversely, the companies purchasing this sold-out hardware face margin scrutiny. Zscaler shares fell after the company lowered its free cash flow guidance due to rising AI infrastructure capital expenditures. However, software names monetizing these investments advanced: Snowflake (SNOW) rose +25.66%, generating a +26.98% absolute return in the last hour on 0.9× its typical volume pace as Q1 AI adoption metrics were released ahead of the official close, as reported by businesswire.com.
The China macro narrative added another divergence. The China factor rose to z=+2.23 today, outperforming on a residualized basis, yet the KraneShares CSI China Internet ETF (KWEB) fell -0.75%. This divergence stems directly from PDD Holdings (PDD), which declined -10.57% after reporting an earnings miss as it prioritizes supply-chain investments over short-term margins, according to globenewswire.com.
Richmond Fed Survey of Manufacturing Activity: The composite index rose to 13 in May from 3 in April, exceeding consensus expectations and signaling a rebound in Mid-Atlantic factory activity, according to the WSJ.
Dallas Fed Texas Retail Outlook Survey: Service and retail activity displayed resilience across trade and transportation subsectors, though forward hiring and capital expenditure metrics reflected persistent geopolitical drags.
Data compiled by FactorPulse AI; edited and verified by Jeff Klein. For informational purposes only. Does not constitute financial advice, an investment recommendation, or an offer to buy or sell any securities. Always consult a qualified financial professional before making investment decisions.
For more on factor construction methodology, see www.factorpulse.com/glossary.